I’ve just added rcloneMon to GitHub!
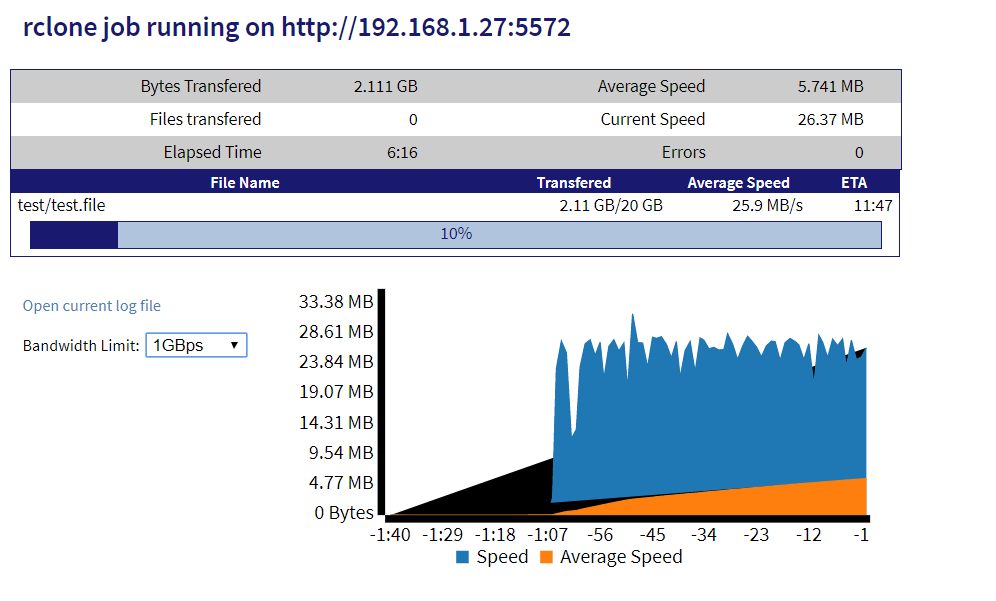
It’s a web based remote monitor for rclone jobs (running with Remote Control enabled). It will display progress and statistics about, including progress bars and bandwidth usage over time.
Check it on GitHub:
I’ve just added rcloneMon to GitHub!
It’s a web based remote monitor for rclone jobs (running with Remote Control enabled). It will display progress and statistics about, including progress bars and bandwidth usage over time.
Check it on GitHub:
Very nice - thanks for posting 
A very nice use of the rc interface and --rc-files.
Really nice. I wonder how difficult it would be to get this to work as a my-netdata.io plugin? I may need to give it a try.
John
I will give it a more detailed look later. From what I know it requires 2 pieces of code: one to “collect” data and another to “display”.
I did play around with adding some things to netdata and it seems pretty straight forward.
That was how I made a new data entry, it seems pretty easy to use the stats and dump it into netdata with a template and report it that way. If I get some time, I may give it a whirl.
Sorry my stupid question, but i don’t understand what to put in config.json in:
Servers->name
Is it the name of my rclone mount?
config.json is used to inform the Javascript based GUI where (host and port) rclone Remote Control is running. rcloneMon config.json can handle the configuration for several different rclone based jobs.
The are two keys in the json file: servers and jobs
servers define the actual “host” and “port” that the GUI is going to connect to.
jobs: describe one or more jobs that can run on the servers.
For exemple:
Servers: define 2 servers in the same host, one (a) running at port 5572 (default port) and another (b) on port (5573).
Jobs: define a job “job1” for sync on server (a), job “test” that runs on server (a) and “jobB” that is set to run on server (b).
In the case of monitoring a mount on a single computer (assuming it runs at IP address 192.168.1.200, something like:
{
    "servers": [ {
                    "name":"myComputer",
                    "addr":"192.168.1.200:5572",
                    "description":"This is the server where the mount runs",
                    "speedcap":13107200,
                    "bwidth":{"5M":"5MBps","10M":"10MBps","off":"Unlimited"},
                    "logfile":"rclone.log"
    } ],
    "jobs": [ {
                  "name":"remoteJob",
                  "server":"myComputer",
                  "description":"This is the job to monitor"
    } ]
}
Assumes a 100Mbps bandwidth, so the speedCap and Bandwidth settings can change.
Pretty cool. Was a bit fidly to get setup, I’ve never used the rclone built in web server. Took me a moment to realize the url in my case was ‘http://192.168.1.27:5572/rcloneMon.html?job=vacuum’
Are you getting the “black” area behind your graphics or this is just the screenshoot?
If you are indeed getting it, can you tell me the OS and browser?
Just a heads up for the upcomming version that will include:
Right now rclone has no API to obtain this info, so I had to work it out on my wrapper script. I wrote a small log processing script that dumps a “status” file whenever rclone writes the stats to the log file.
Still need some brushing (better process handling - it forks 2 processes). If anyone knows a better way to get total bytes/files and ETA, please let me know.
Another advantage of the wrapper I wrote is that it keeps tabs on jobs, so it’s possible to know if the job is running, when it started/ended and the result (success or failure). For scenarios like babysitting jobs running on a headless box, this is really cool.
I’m planning to support a job completion exit to allow for informing the user the job result, such as email/SMS/Push.
That black area does exist - It’s Windows 10 home and the latest Chrome.
John
Will check it. If this indeed happens I will switch to another graphing library.
Hm. Looks the same on Android and Chrome, too. I do have cs.jar and ds.jar (along with the mini) files in my directory - could that cause issues?
I had the black area when I forgot either d3.min.js or the c3 CSS file (can’t remember which). This was also win10 and chrome. You might want to check those.
@aviegas Regarding this, why is --rc-files necessary? It seems to work fine without.
@jad3675: do you have the c3.min.css and d3.min.css on the same directory?
I was missing c3.min.css from the directory. I put it there and now the graph looks as it should.
John
Glad to know it's ok now!
As with @jad3675 - I fixed it by adding all the files as specified.
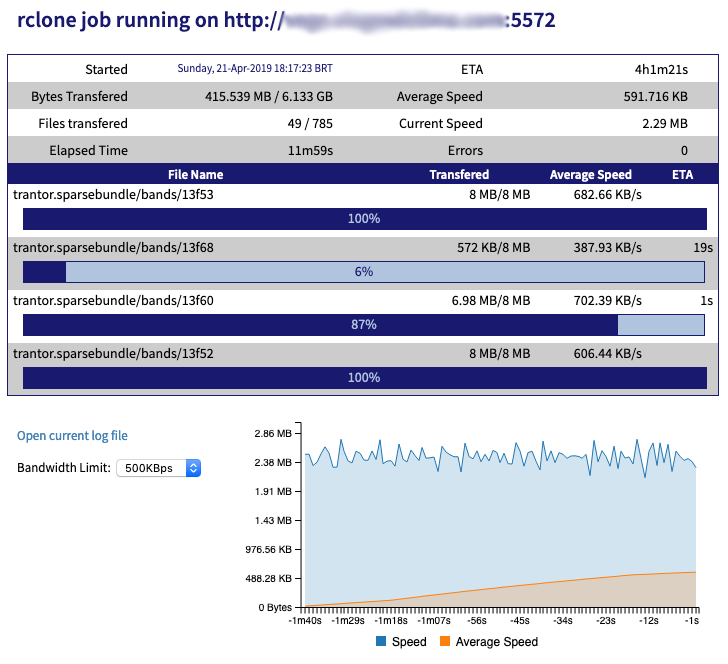
However, I do have this wobbly animation:
This is because rclone stats sometimes misses or combine samples.
There are 2 ways to avoid this phenomena:
The first one is better, but harder to code. So I’ve added the “speedcap” parameter in the config.json. This will effectively limit the upper peek of the graph.
Set speedcap to the maximum value of your Internet uplink (in Bps = Bytes not bits and use 1K=1024 not 1000).
For example, I have a 20Mbps uplink (wish I had much more). So it’s 20x1024x1024/8
I hope this helps. When I’m done with other features I’m adding I will look into some smoothing algorithms.
You can also adjust the bandwidth control settings, again, in BYTES.