I am trying to copy files (sample size) from local EXT4 filesystem to GCS. I have observed that the total memory being consumed by rclone increases linearly. I made some changes to the code to disable checks and API calls.
I am using Rclone v1.49.3 with ubuntu-18.04 64 bit as source.
Changes made:
The testdata contains around 16000 small size files (10-50 bytes) distributed evenly across sub directories with depth level of 5.
Bucket has already been created before the transfer is started.
config only contains the service account credentials for GCP.
Disabled the fetch metadata call for --no-traverse. 1 API call for each file scanned. Commented backends/googlecloudstorage/googlecloudstorage.go L465-472.
Disable fs/sync/sync.go -> pairChecker. Whatever file comes in the pipeline is then sent out without any checks.
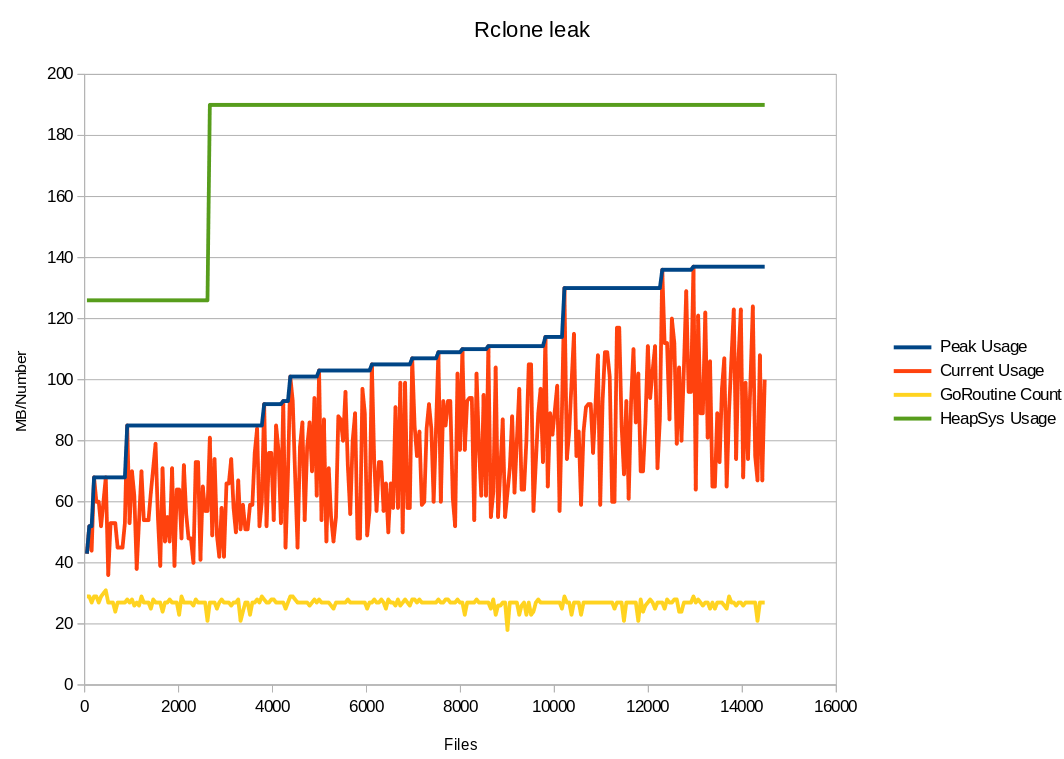
Added a Memmory Logger function which logs Heap and Sys Memory usage after every 50 file transfers.
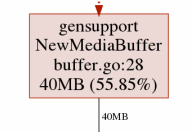
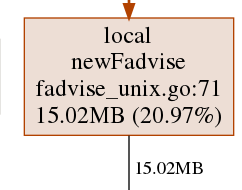
Total Memory usage is increasing linearly as the number of files transferred is increasing. The Heap allocation varies in a range of 30-70 MB But there are spikes where Heap usage goes upto 137 MB. Please see the log attached. See Logs Here See Memory Profiles Here
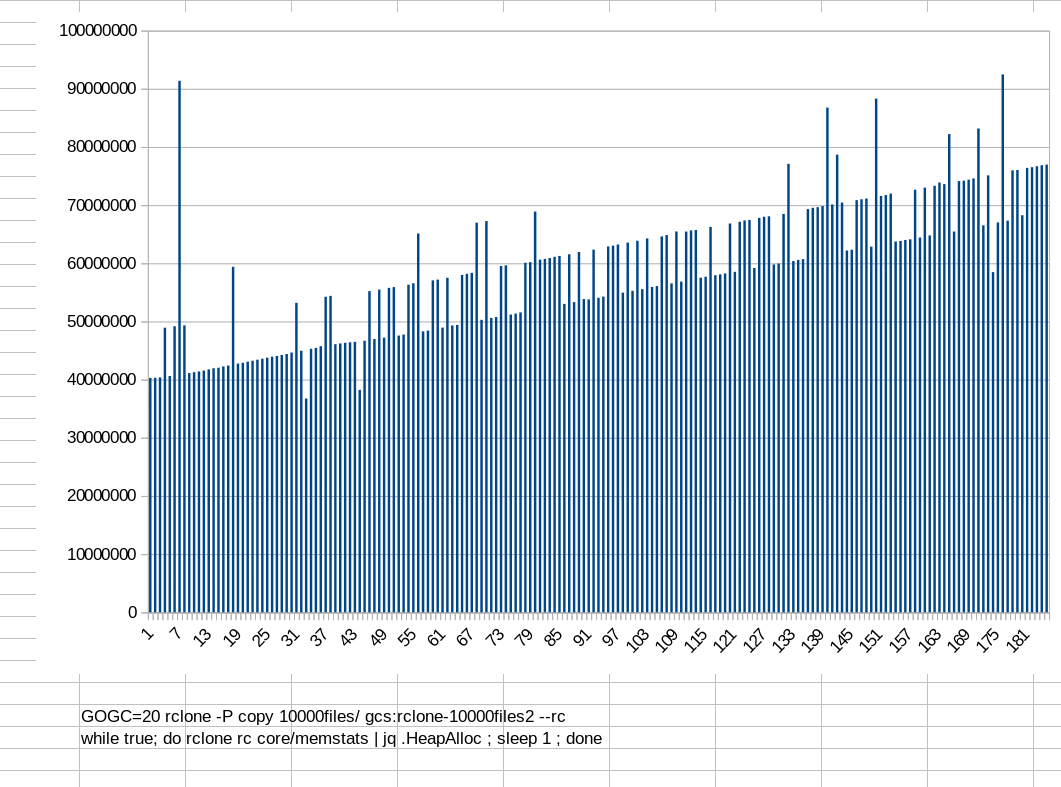
I also tried to reduce the Garbage collection threshold to 20 (export GOGC=20) but still no improvement in memory management.
What could be the reason for this memory increase?
There definitely was a memleak fix recently. I don't know the details of it though. It should be noted in the changelog, but re-testing on the latest version would be advisable yes.
Still I am seeing a linear increase in memory usage in all the cases given above.
I also tried splitting the source into batches of 1000 files each (using temp files with --files-from flag) . At any given time only 1 batch is running (Batches are transferred sequentially). Technically it should release the memory after every batch but usage is still increasing. (Code is given below).
The next batch is started only when the current batch has finished all the transfers. Profiling after 3/4/5 files ... is printed when a new batch comes for processing. Even at this stage, the memory usage is increasing as the number of files transferred increases.
func createBatch(csvReader *csv.Reader, batchSize int, sourcePath string) []string {
	var batchFileCounter int
	var batch []string
	for {
		record, err := csvReader.Read()
		if err == io.EOF {
			break
		}
		if record[1] == "False" {
            // Returns the relative path of a file compared to the source directory
			relPath := utils.GetRelativePath(record[0], sourcePath)
			batch = append(batch, relPath)
			batchFileCounter++
		}
		if batchFileCounter == batchSize {
			batchFileCounter = 0
			batchCounter++
			break
		}
	}
	return batch
}

func createTempFFL(batch []string, sourcePath string) error {
	file, err := os.Create("temp_ffl.txt")
	defer file.Close()
	if err != nil {
		return err
	}
	for _, path := range batch {
		file.WriteString(path + "\n")
	}
	return nil
}

cmd.Run(false, true, command, func() error {
    err := setTempFFLLocation()
    operations.CallProfiler(1)
    if err != nil {
        return err
    }
    args = append(args, sourcePath)
    reportFile, err := os.Open("ffl.csv")
    operations.CallProfiler(2)
    if err != nil {
        return err
    }
    defer reportFile.Close()
    csvReader := csv.NewReader(bufio.NewReader(reportFile))
    for {
        operations.CallProfiler(3)
        batch := createBatch(csvReader, 1000, sourcePath)
        operations.CallProfiler(4)
        if len(batch) == 0 {
            break
        }
        err = createTempFFL(batch, sourcePath)

        // Freeing memory taken by batch slice variable
        batch = nil

        operations.CallProfiler(5)
        err = rcloneutils.SetFileFromFlag(tempFFLLocation)
        if err != nil {
            return err
        }
        fs.Config.NoTraverse = true
        fs.Config.IgnoreChecksum = true
        if srcFileName == "" {
            err = sync.CopyDir(context.Background(), fdst, fsrc, createEmptySrcDirs)
            if err != nil {
                return err
            }
        } else {
            err = operations.CopyFile(context.Background(), fdst, fsrc, srcFileName, srcFileName)
            if err != nil {
                return err
            }
        }
        fs.Infof(nil, "Processed Batch Counter - %v", batchCounter)
        runtime.GC()
    }
    return os.Remove(tempFFLLocation)
})
@ncw I double checked and started another copy and the results were same. I also ran the test on a large file base (500K+ Objects). Memory Profiles Here
For 500K Objects Total Memory Allocation was around 1.2 GB and Heap Allocation was around 900 MB. (Without splitting the source into batches).
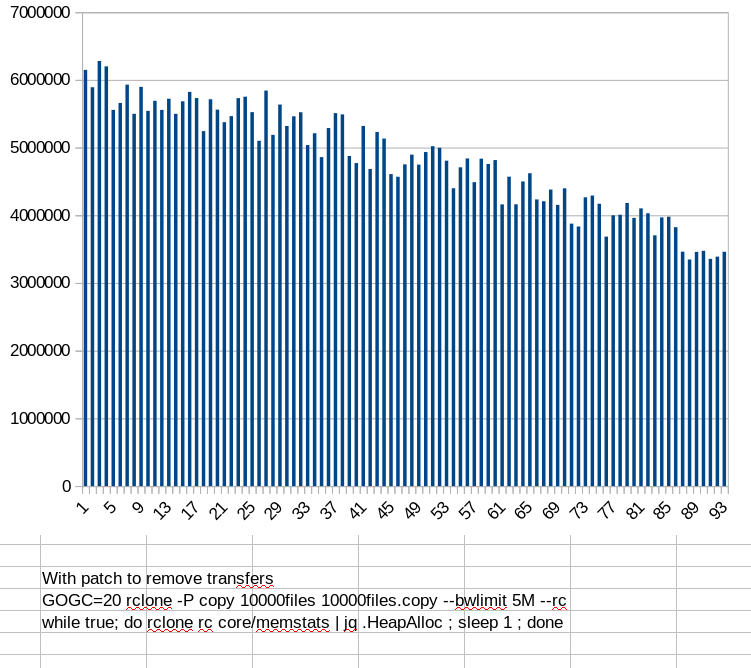
After a lot of digging I found the leak! (in fact I found two). The main leak was in the transfer statistics - the objects weren't being reaped from them. The memory usage goes down over time as the transfer pipe is emptied which was the other minor leak.
@ncw
The memory leak issue seems to be resolved. I have started a transfer for a large dataset (500k objects). After it is completed will verify the results.
But this introduced a regression. The elapsed time in progress stats keeps getting reset after every file.
It was a lot more complicated than I thought it would be! The accounting contained the assumption that we would keep the completed transfers around forever which was causing the memory leak.
I've fixed that now and would really appreciate your testing!
v1.50 should be released at the weekend or on Monday I think.
I've been seeing this as well, specifically with backing up hierarchies with simply enormous numbers of files (one job processes at least 2 million files). I've moved the beta binary into place and will see how tonight's backup fares.