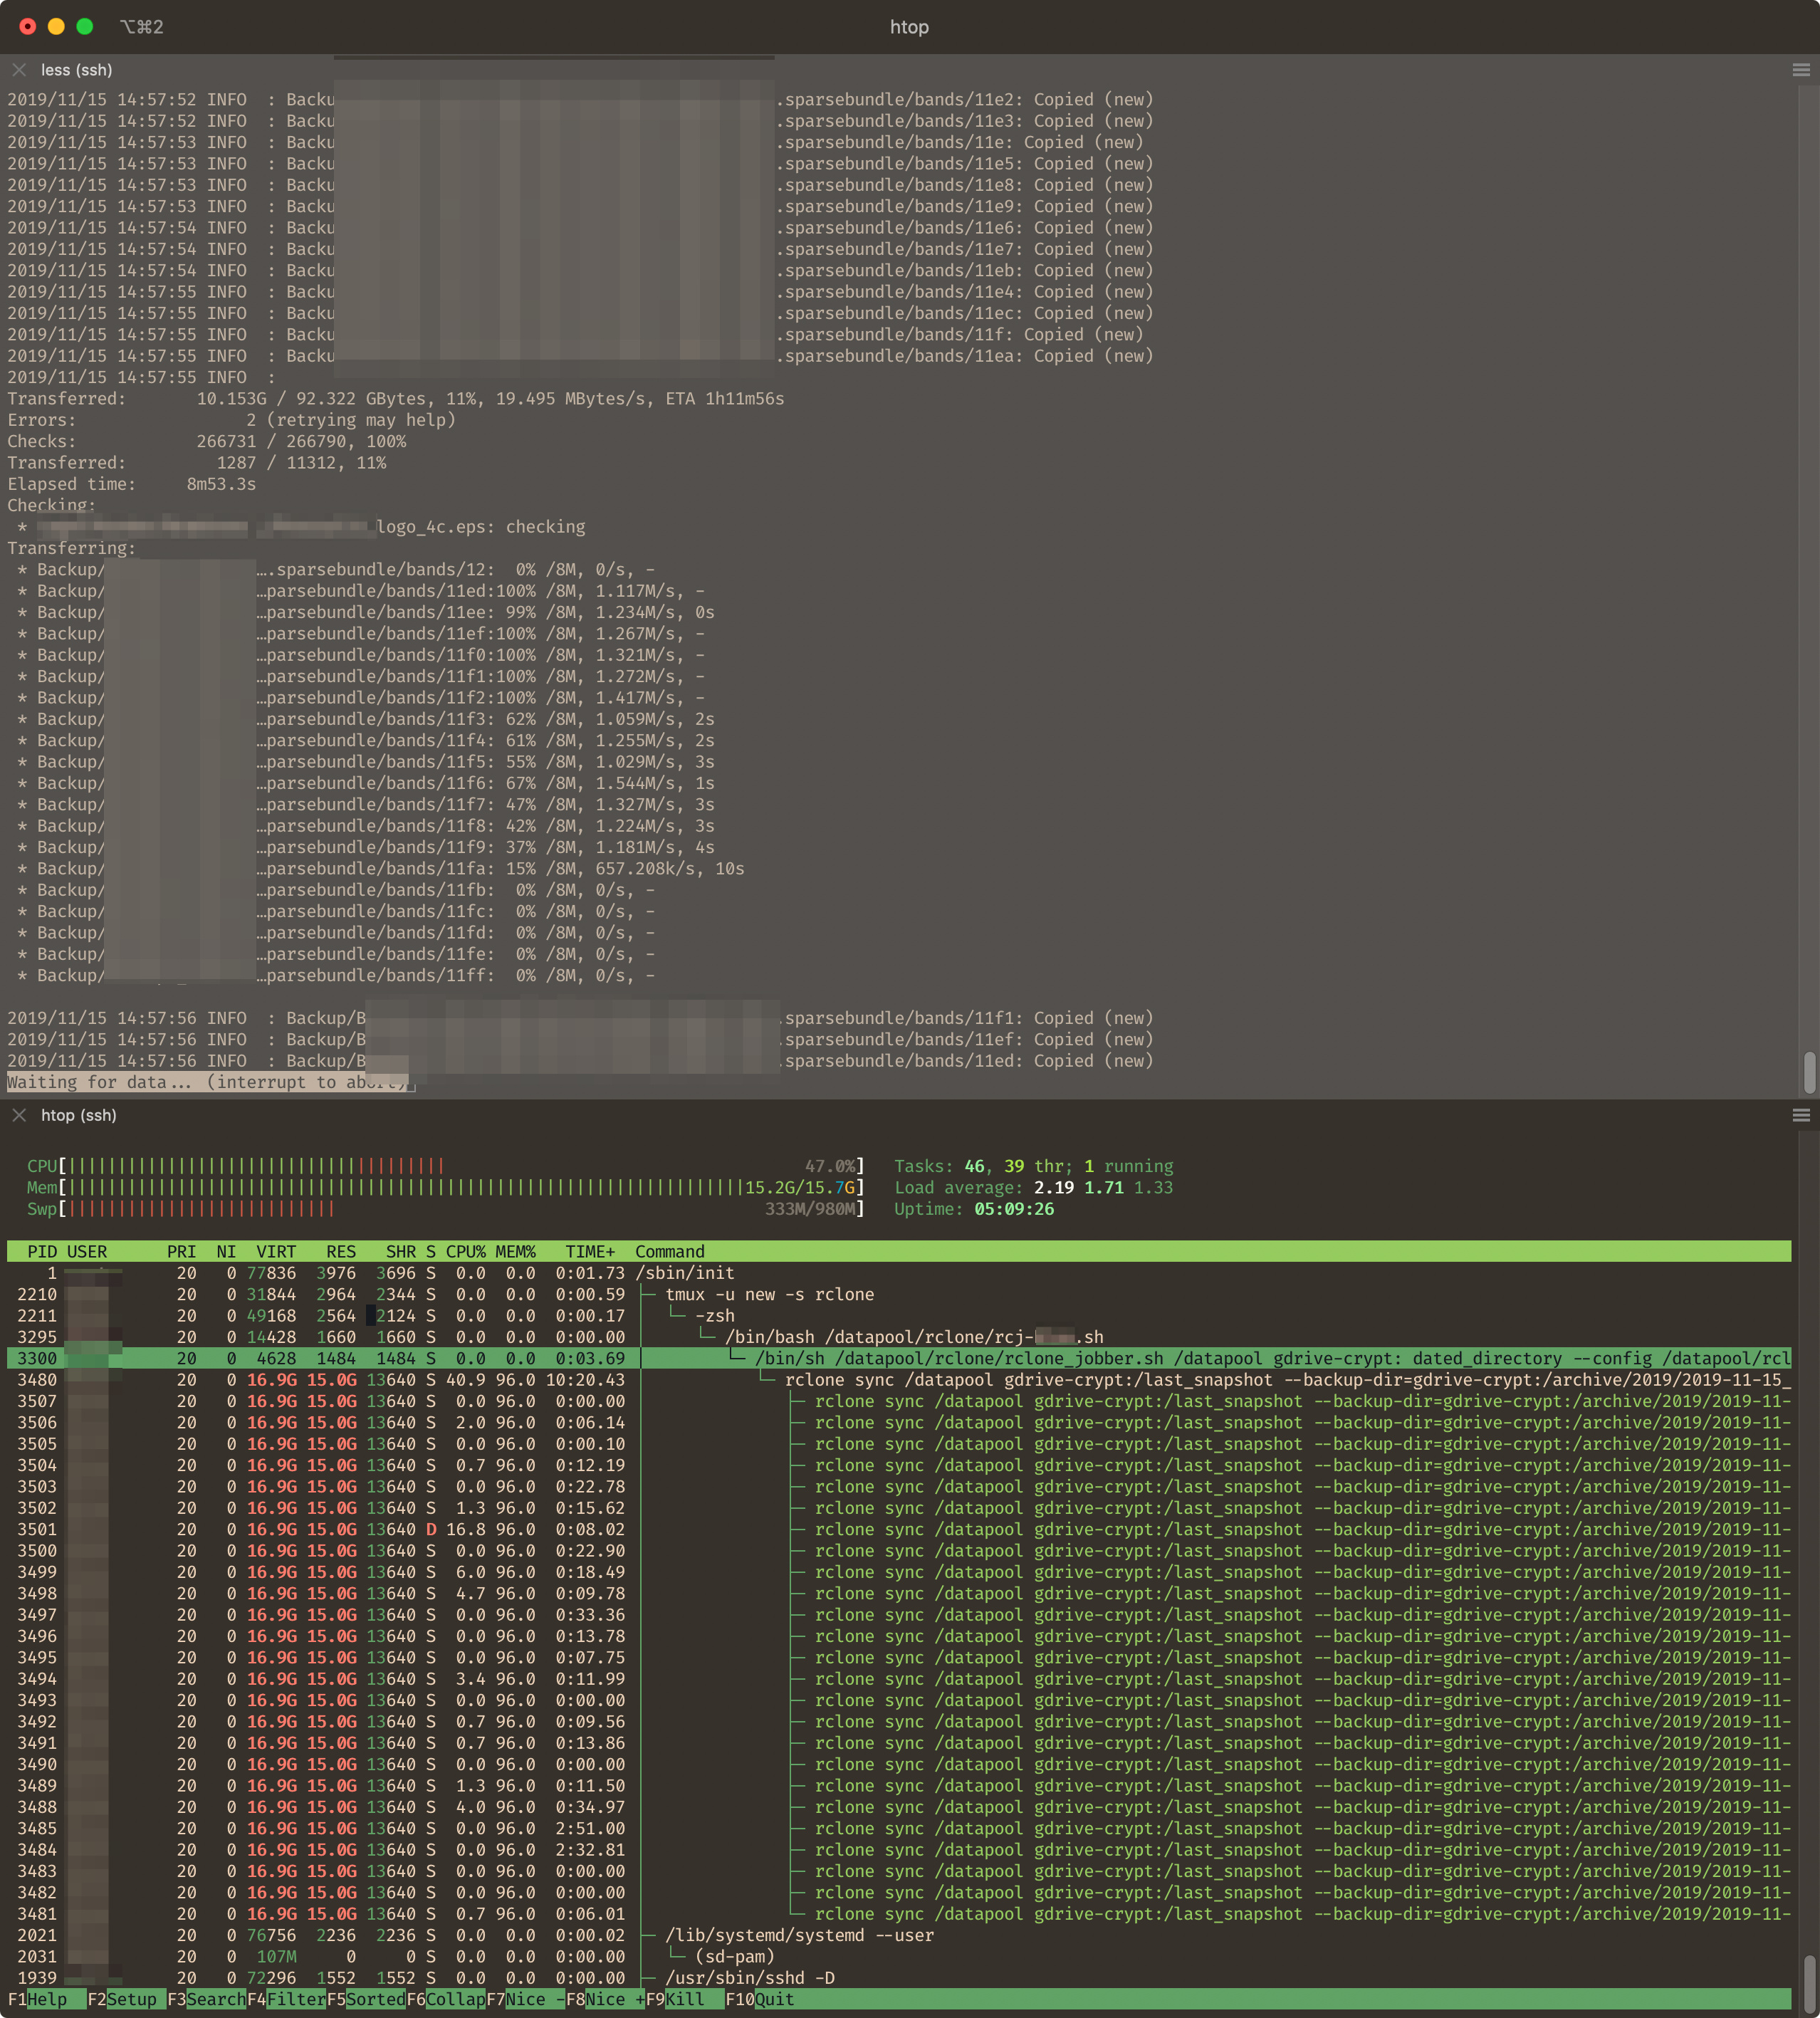
I just ran out of memory, that has never happened before. I'm currently backing up a sparseimage, so have a lot of files. It was going great with 300mbit/s speed ish.
This is a VM with 16GB of memory.
Is there any issues with my command? Is 24 transfers, 24 checkers, and drive-chuck-size of 256 too much?
I believe the way it works is based on transfers as you have to take into account buffer size * drive chunk size.
I'm not sure the exact memory usage that a checker uses.
With 24 transfers and 24 checkers, your logs are probably flooded with 403 rate limit errors since Google only allows ~10 API calls per second and you can only create 2-3 files per second.
I use defaults with the only upped being drive-chunk-size at 128M and max out my gigabit line all the time.
The biggest memory-drain in that config is for sure transfers + chuck-size.
These are multiplicative. Ie this setup can (just for the chunks) use 6GB. This is excessive for sure.
256MB chunks are usually a waste anyway. 64MB and up you will have good performance on large files. There isn't many percent of bandwidth utilization to gain from going up to 128MB, and up to 256MB it's even less gains - so scale back on that.
Secondly - Google drive just can't handle 24 transfers most of the time. Or rather - it can handle that many transfers, but it can't start more than a little over 2 pr second - so the only time you would use anywhere near that many is if the files were very large - and in that case there is little to no benefit of having more than 4 transfers anyway as your bandwith will be the limiting factor.
For small files (where normally many transfers would help on some backends) it just won't do anything for you because the files-pr-second limit will be the limiter anyway. The files will just finish transferring too fast for them to stack up.
24 checkers is similarly probably overkill. This won't face the same limiter, but it still has to abide by the API's 1000requests pr 100 seconds (ie. 10/sec if not bursting).
If you weer using a high-performance "hot-cloud" like wasabi or backblaze things might be different, but for Gdrive I think you have fallen into the trap of thinking "more is better" here. I think your settings are more likely counterproductive if anything.
Defaults are 4 transfers, 8 checkers. I would not recommend anything more than 5 transfers and 10-12 checkers on Gdrive, and even that is unlikely to be all that beneficial over stock as you will already be close to the effective limits of the backend. 128MB chunks is also "more than enough".
With those settings you'd have a much more reasonable 640MB used for chunking, or nearly 10 times less RAM - and basically get the same performance anyway. If you really care about 1-2% more efficiency on large files then stick with the 256MB chunks as you can probably afford it now on 5 transfers. (1280MB)
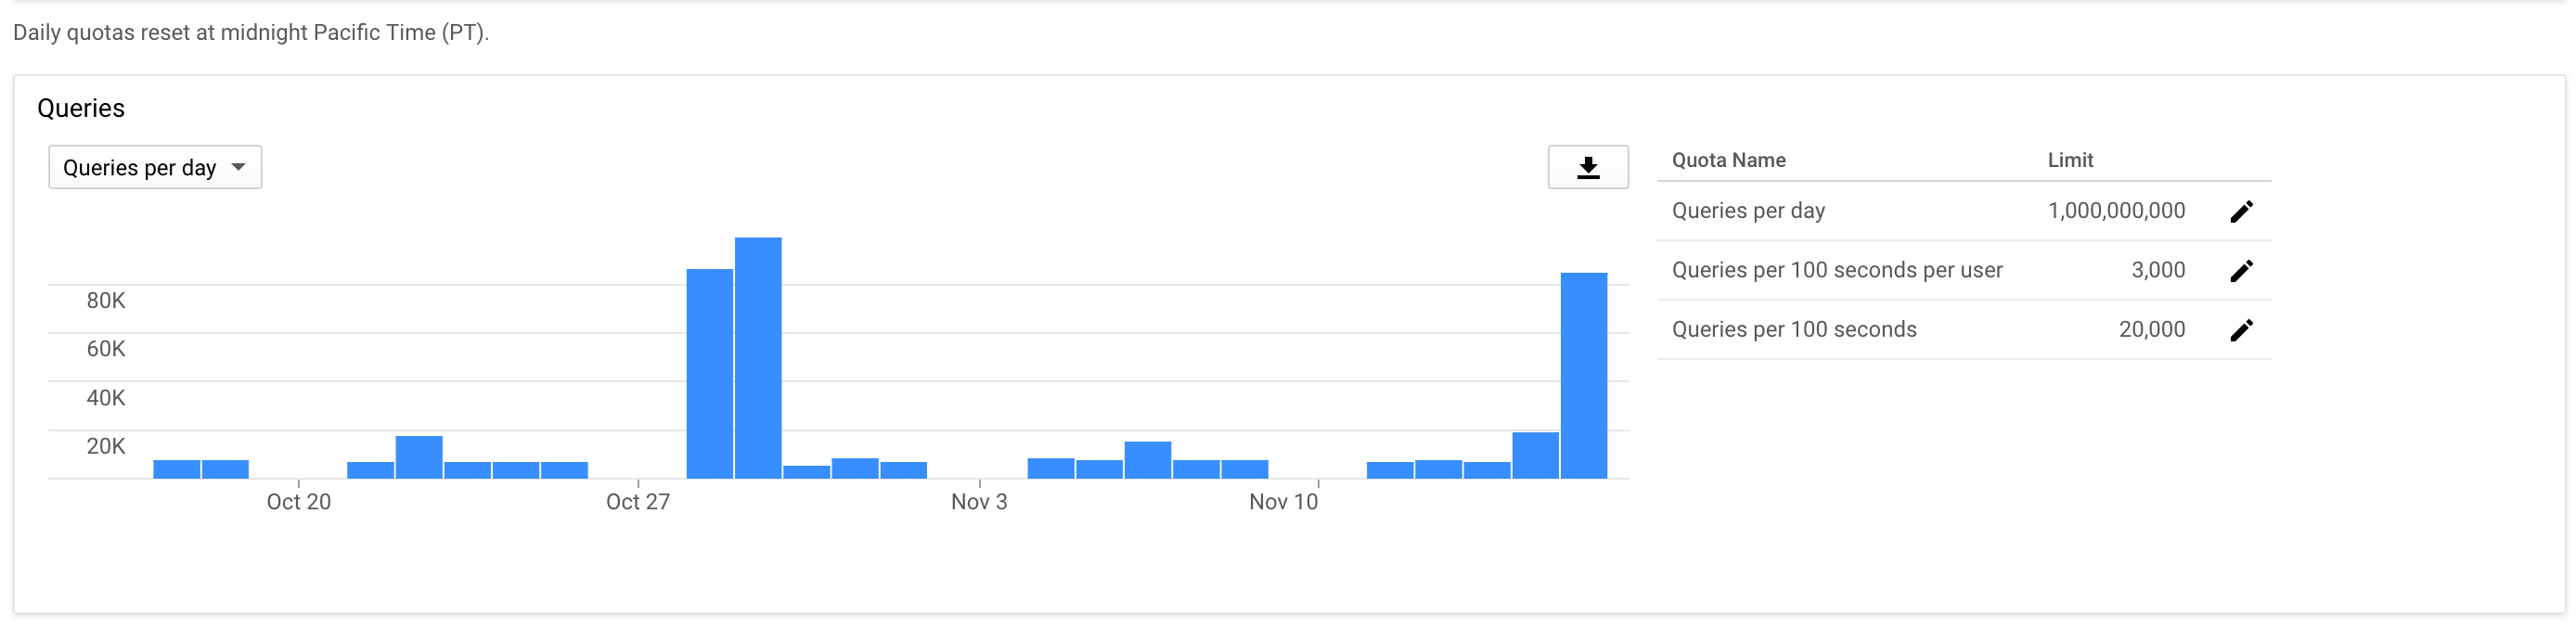
Thanks for the explanation. I must admit I'm not totally on top of this. I've read different posts that suggest my current settings, so that's where it's from. Anyhow, I have log level info, and I don't have any rate limit errors (I think I'm seeing those at that level, because I had a few earlier, before I asked google to up my quotas).
I can say – if I remember correctly – the daily backup takes way less time now, than it did prior to me adjusting the transfer, checkers and chunk-size.
It's a daily backup of (mostly) design projects, so each project can have a quite a bit of files in varying sizes from 100 KB to100GB. Today was a bit special, since I'm backing up a few sparesbundles.
Gdrive has a built-in pacer that will try to make you stay within the API limits, so no matter how high you set transfers and checkers the pacer will reign you in a bit on that.
Actually - since you have higher than default API limits you may want to adjust that. Your 100-sec burst and long-term limit is 3x normal so you may want to adjust that accordingly. Then you should actually be able to use checkers more liberally. 24 doesn't sound so bad then.
More transfers is still highly debatable, as the API has nothing do to with the file-transfers pr second limit - at least to the best of my knowledge. I don't know if google will or can up that at the same as the API...
Interesting that Google granted you more quota. I thought they were fairly strict about that. I would be interested to hear what justification they accepted - if you feel ok with elaborating. Feel free to PM me if you prefer to not discuss that publicly. I'm mostly just curious.
I think I ended up with limiting the chunk-size down to 128mb, and keeping the transfers and checkers at 24. I had no issues with them being at that for months. Limiting the the chunk size to 128 mb lowers my memory footprint a bit, so I hope that will be it for now. I'm running it now, so I'll know in a bit.
I recently upgraded to the new 1.50, and read something about a memory leak prior to that, so I was thinking that could be a reason for it to crash due to out of memory.
Regarding Googles quota, I basicly just requested it via their link and then answered their questions.
It ran for a lot longer now, for around 10 hours. --transfers 24 --checkers 24 --drive-chunk-size 128M, but then it crashed due to memory.
I'm not totally sure how that works, but is it possible that there could be a memory leak of some sort? Shouldn't it just release the memory when it's "done with the file" and then continue on to the next?
and dumping the output into a separate log file every 5 minutes.
EDIT:
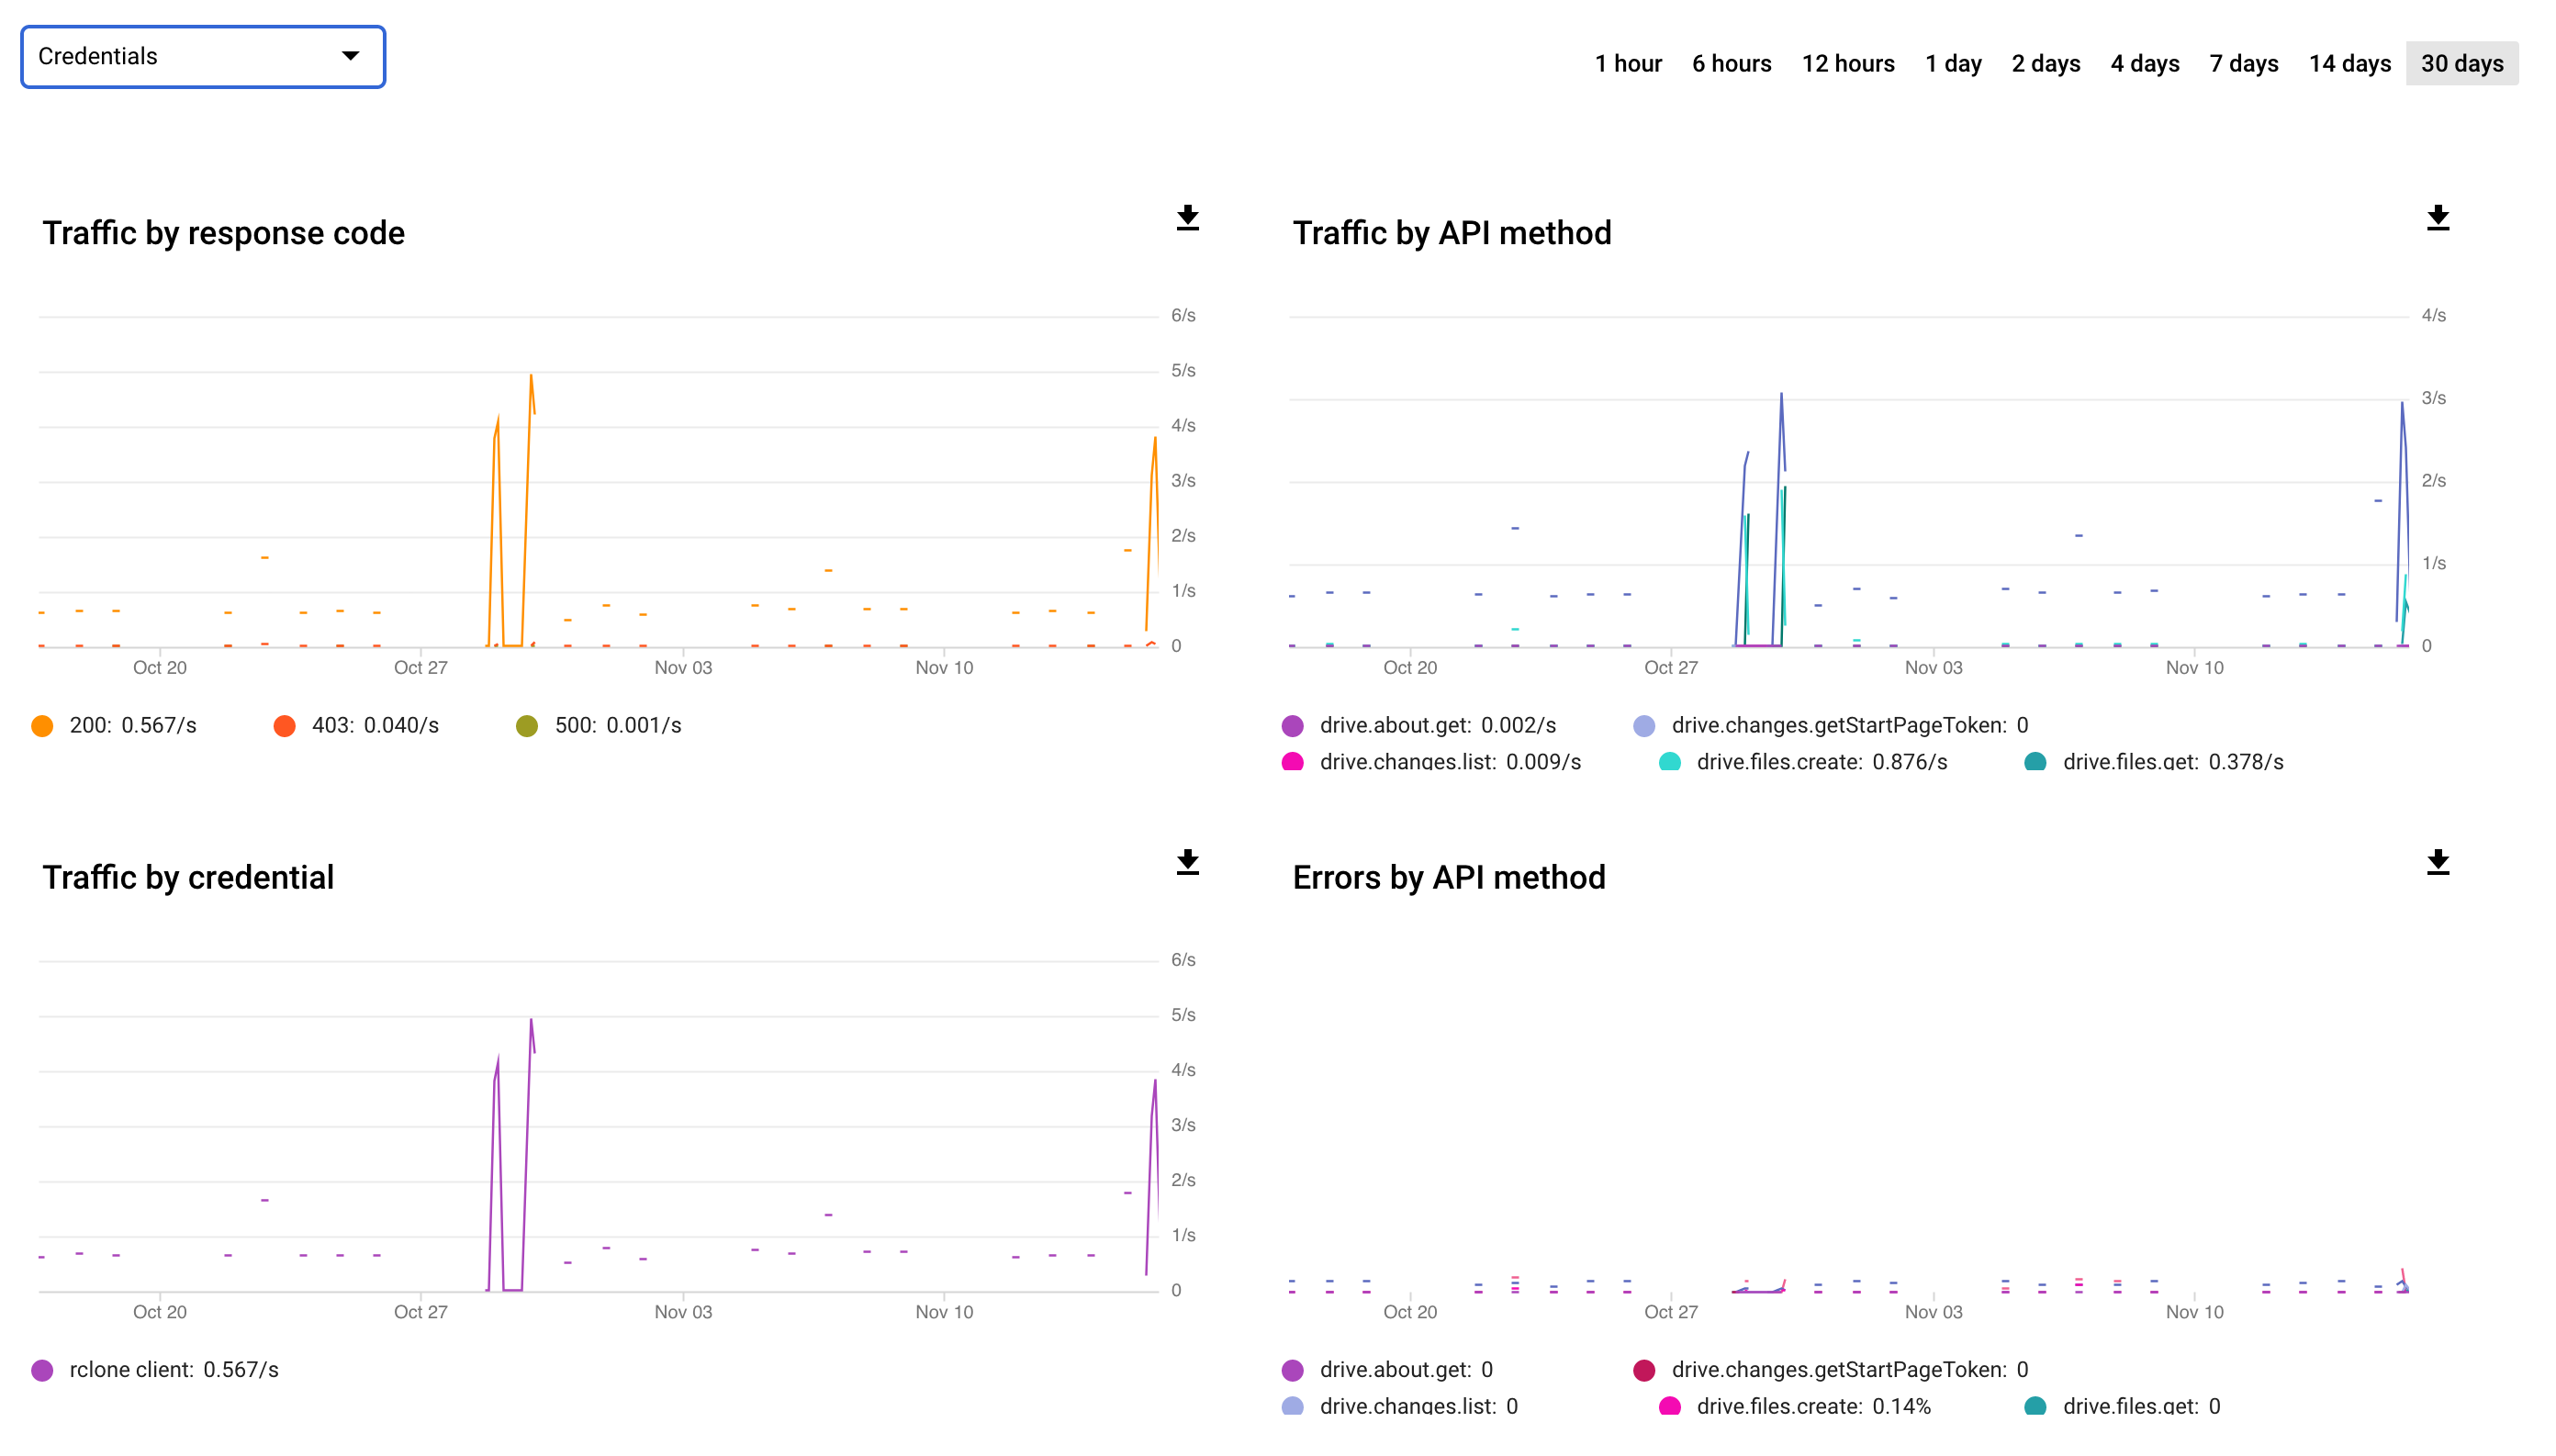
I'm seeing alot more API errors now. Mostly 2XX and a few 4XX for some reason. I guess it could be I've been running this "non stop" more or less.
Well, API hasn't got anything to do with memory just to be clear.
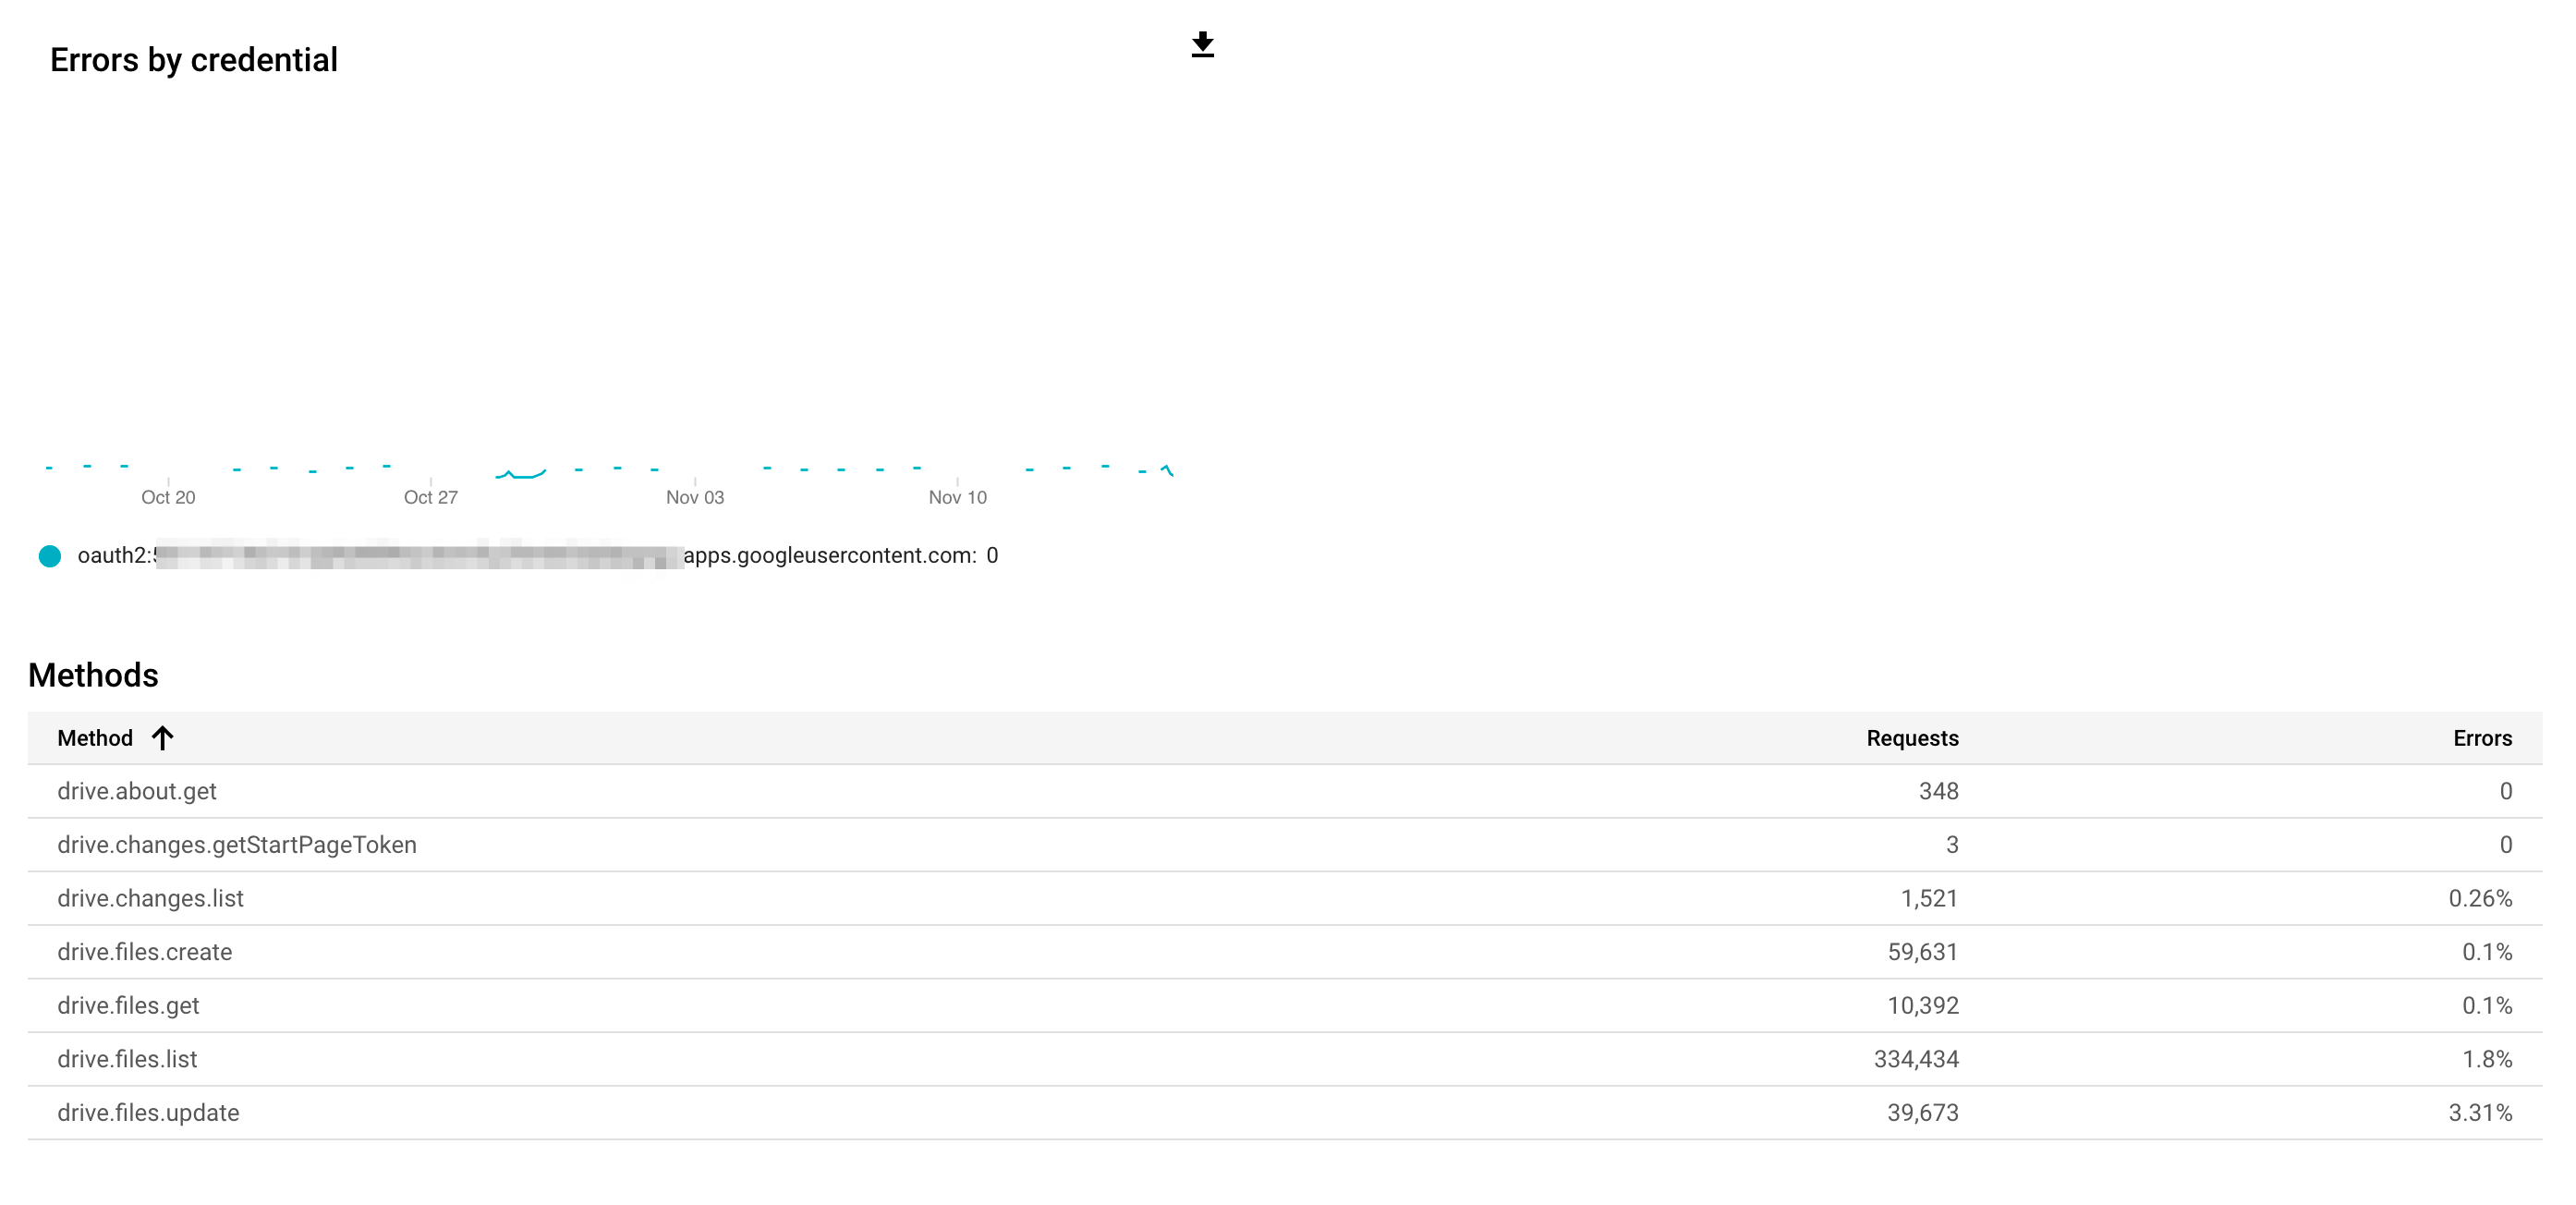
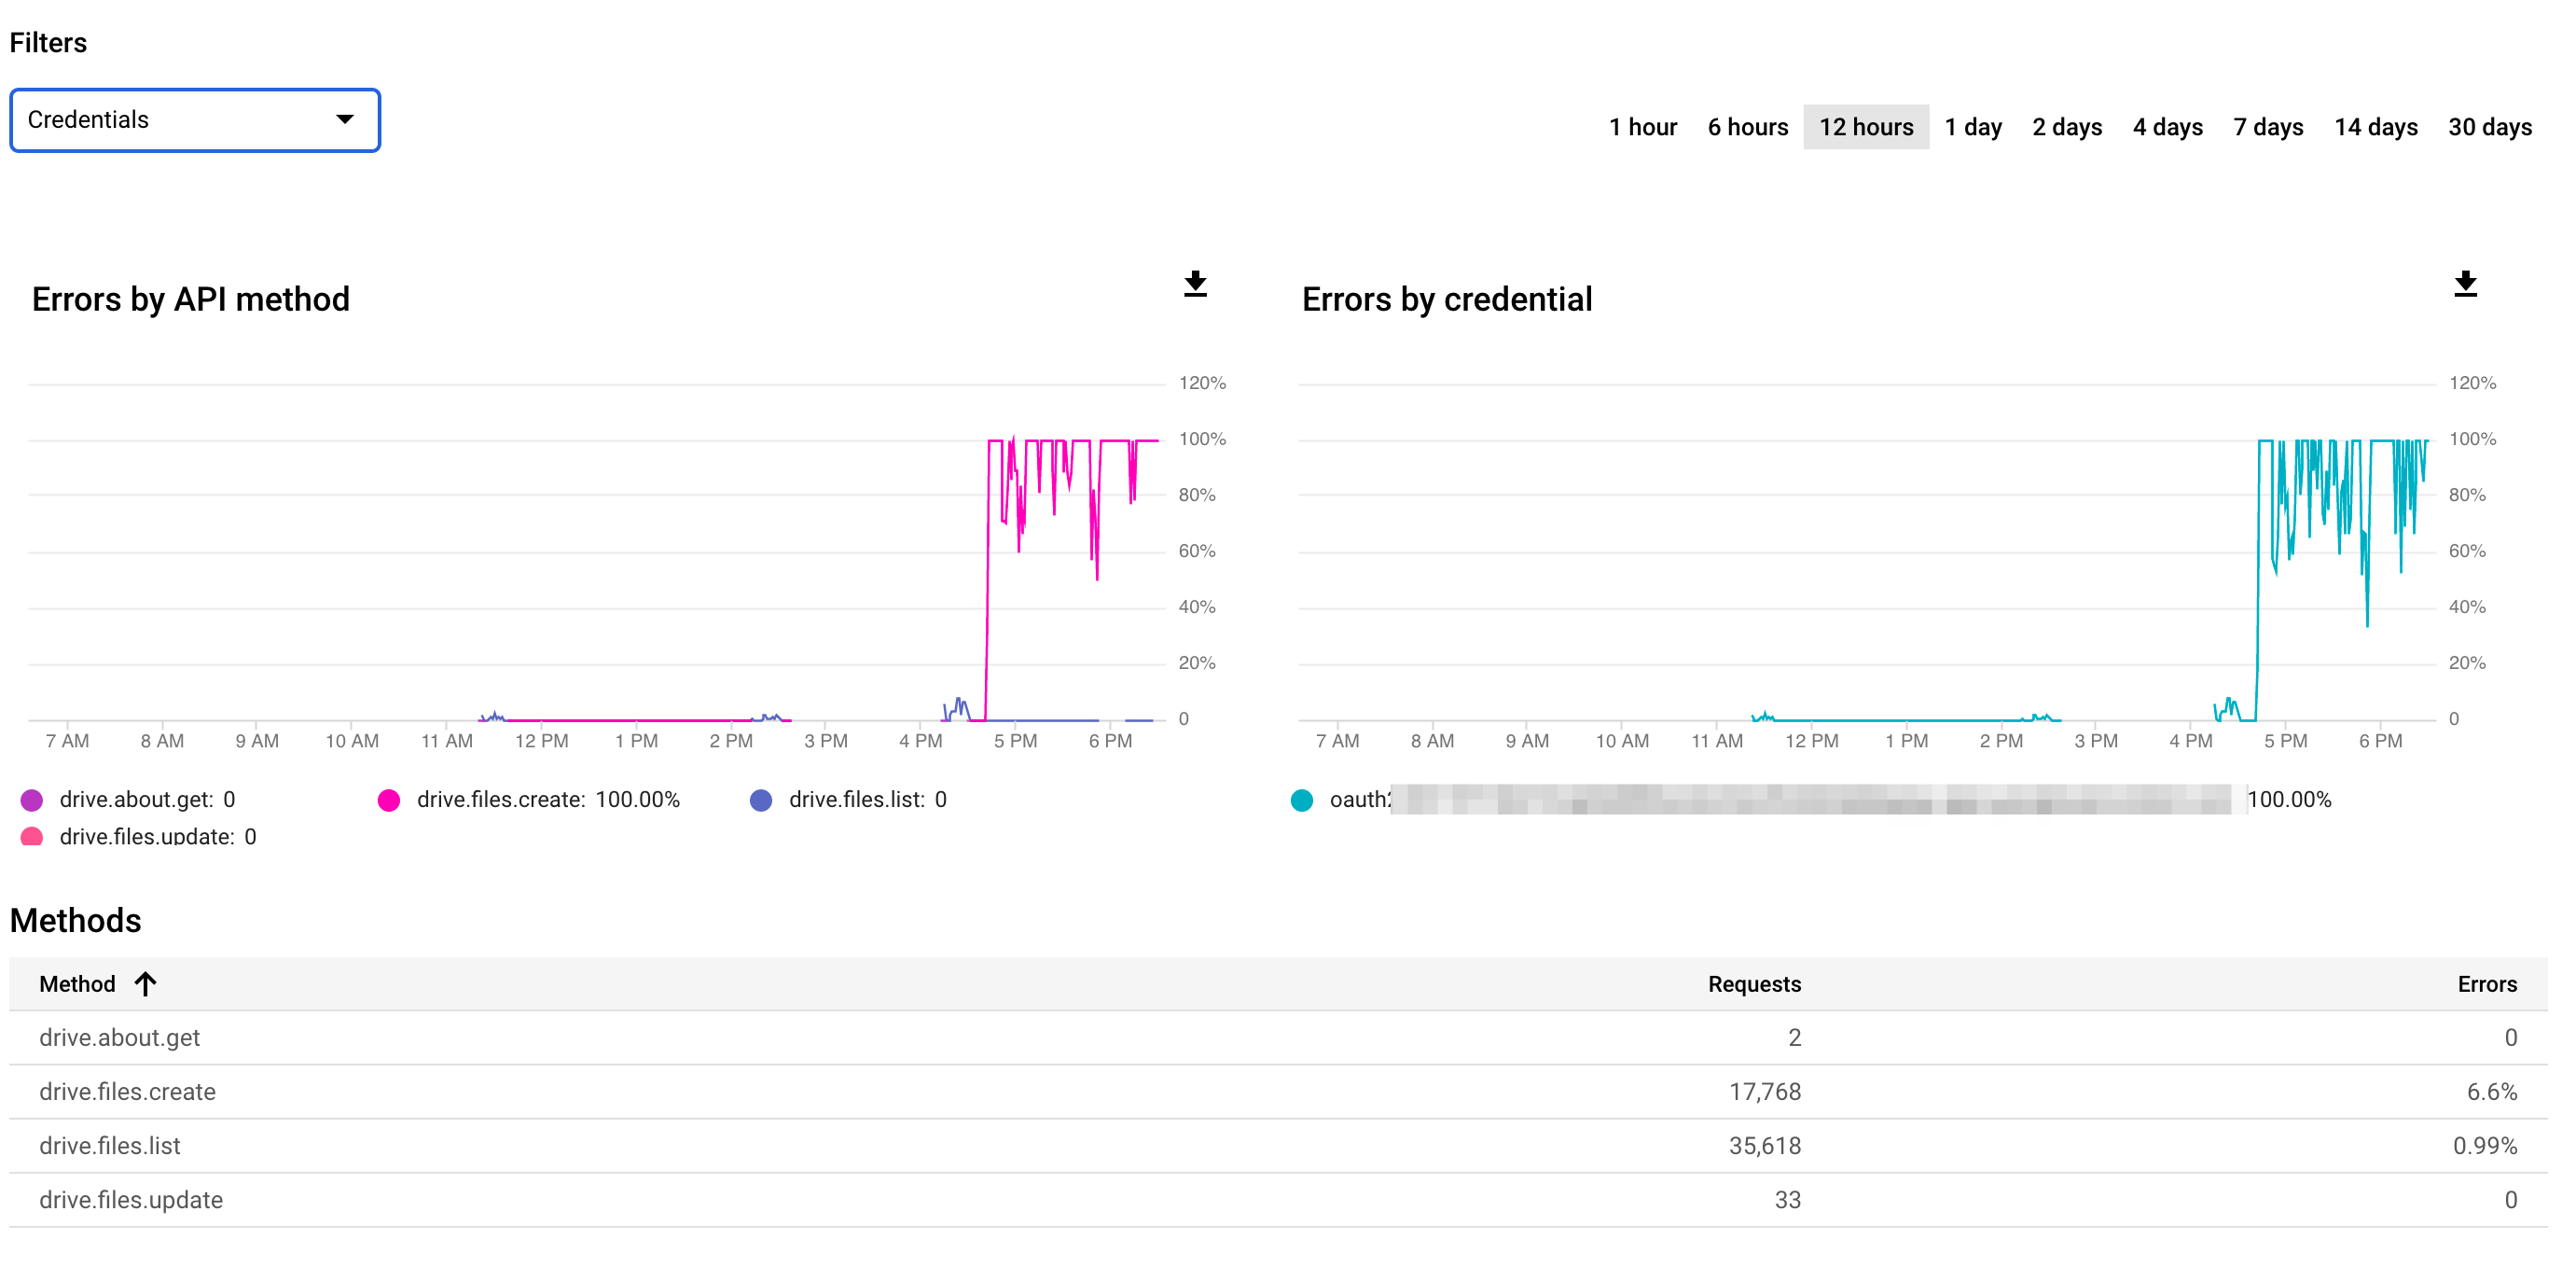
It seems like you've hit a pretty hard wall on what seems to be drive.files.create ? (not sure why you felt you needed to censor the errors graph legend).
What this looks most like to me is you may have hit the 750GB/day limit. At that point all new uploads will get refused with a 403 error (incidentally the same error code that you get from sending too many/fast API requests also unfortunately). Downloads will still function normally however.
When you hit close to a 100% error-rate like that all of a sudden though that usually indicates you hit the data quota. That will reset sometime overnight.
Yes, I figured that. It was more ref. the quota part of the thread. . The data limit is probably it – the dataset I'm uploading is a few hundred gb.
I censored the error graph legend, because it's my oauth "username". ie. oauth2:271871812912-m663qfquiijehd40lhtsc6nm5u25hgng.apps.googleusercontent.com (I've just made up one that looks the same-ish). Not sure if it's a "security risk" or not, but not taking any chances.
Not sure how much data you will get from the two logs, they seem kind of strange to me. But I ran the command like this watch -n 300 curl http://localhost:5572/debug/pprof/goroutine\?debug\=1 >> rclone_memory_goleaks_5min.log
Let me know if you see anything, or want me to test anything further.
From the crash log I see that there are a lot of asyncreader processes running. There should be about 1 per transfer so having 574 is out of order and probably explains the memory leak.
They are almost unreadable unfortunately as they are full of terminal escape codes
Running them like this would probably work better
while true; do curl -q http://localhost:5572/debug/pprof/goroutine\?debug\=1 ; sleep 300 ; done 2>&1 | tee -a log_name.log
It would be really useful to have a full log with -vv too from rclone so I can examine the retries.
What I suspect is happening is that the uploads are being aborted somehow and being retried, but rclone isn't cleaning up the async reader go routines on the abort which is pinning memory.
Would you mind re-doing the above to generate some more readable logs, that along with a -vv log from rclone should let me pin down what is happening
I don't need it to crash with out of memory, just leak some memory
Ok, running it again now. Could be I'm going to hit the rate limit.
Can I send you the log files somehow? That way I don't need to censor anything. It's not anything really secret, but I don't want it "all over internet".
Or even easier, you could just private-message him over the forum. (click his face).
As far as data-leaking in the -vv debug logs go, it's primarily filenames and foldernames that may be sensitive there. Shouldn't leak any directly security-related I believe.
Run it long enough that you can notice an abnormal growth in the memory-usage. First let it run for 5 minutes - check how much memory the process uses - and then check again a bit later. If it has doubled or something to that effect you should have more than enough to demonstrate the issue I would think.
 . The data limit is probably it – the dataset I'm uploading is a few hundred gb.