Very High CPU Usage on Unraid when Running rclone Sync Command

What is the problem you are having with rclone?

I used to run rclone via Rclone Browser on Windows, which performed very well on my old 2012 desktop (i.e. it would max out my gigabit at around 100-105MB/s while not using a huge amount of RAM/CPU).

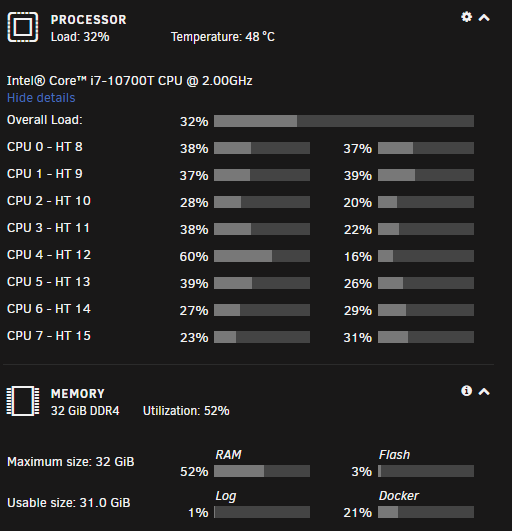
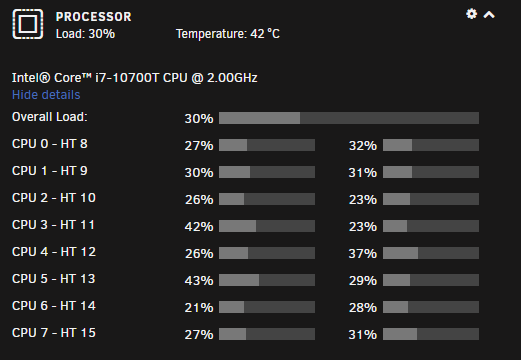
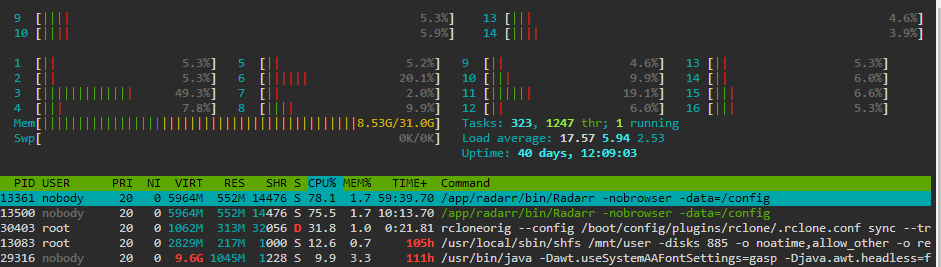
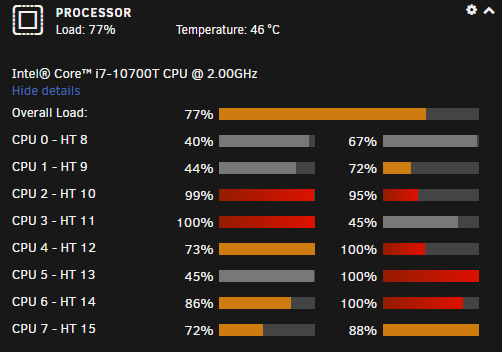
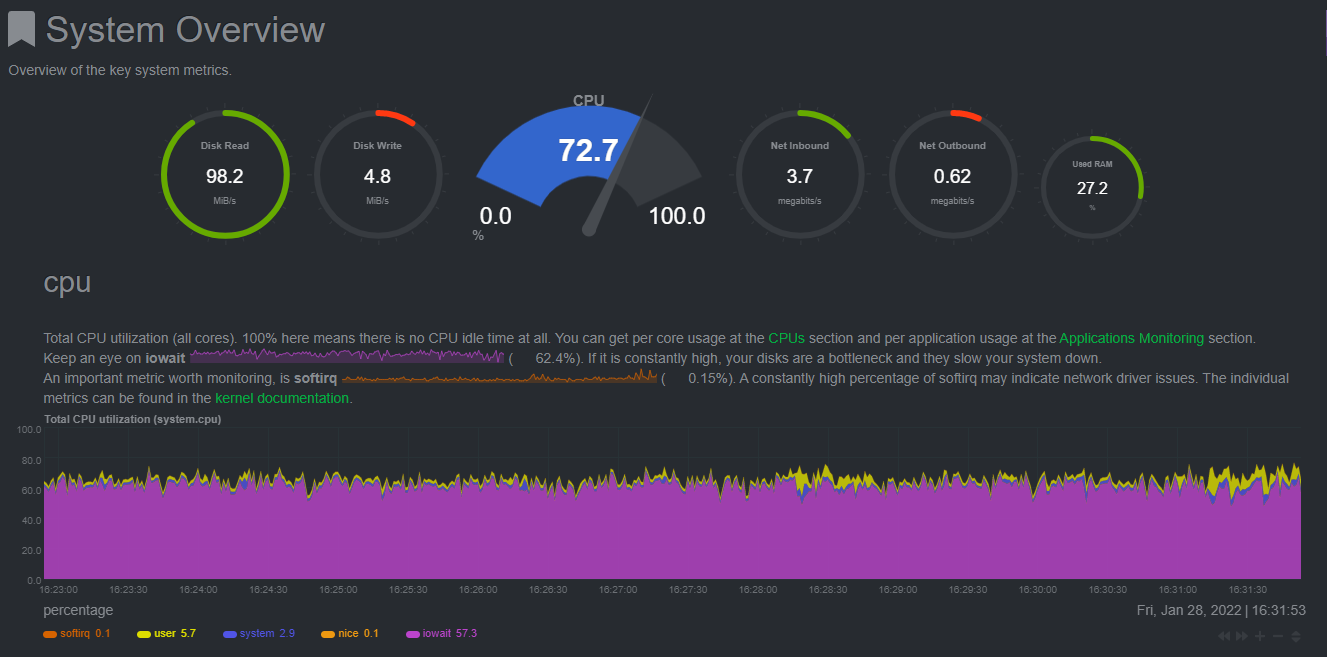
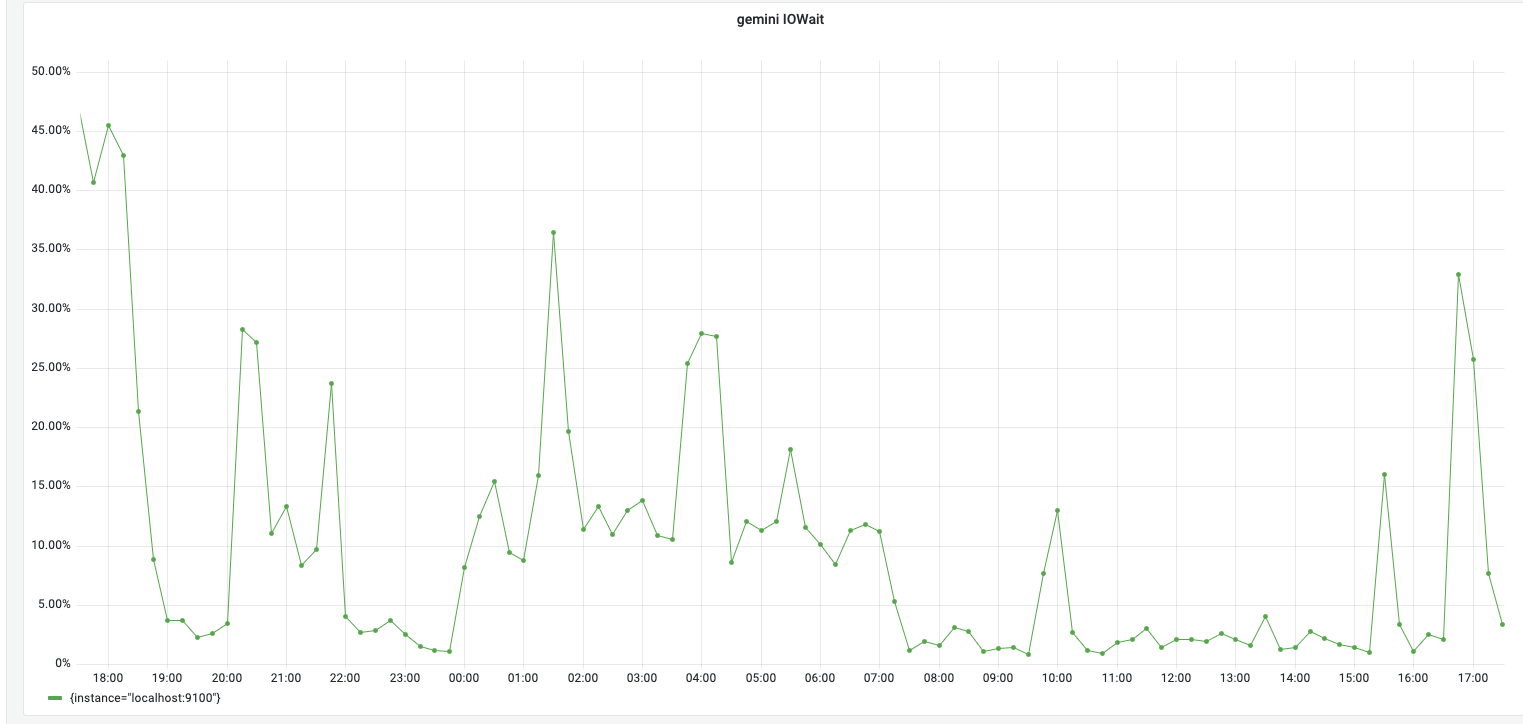
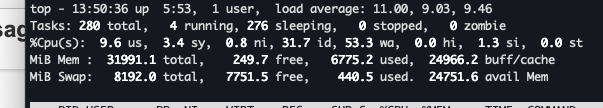
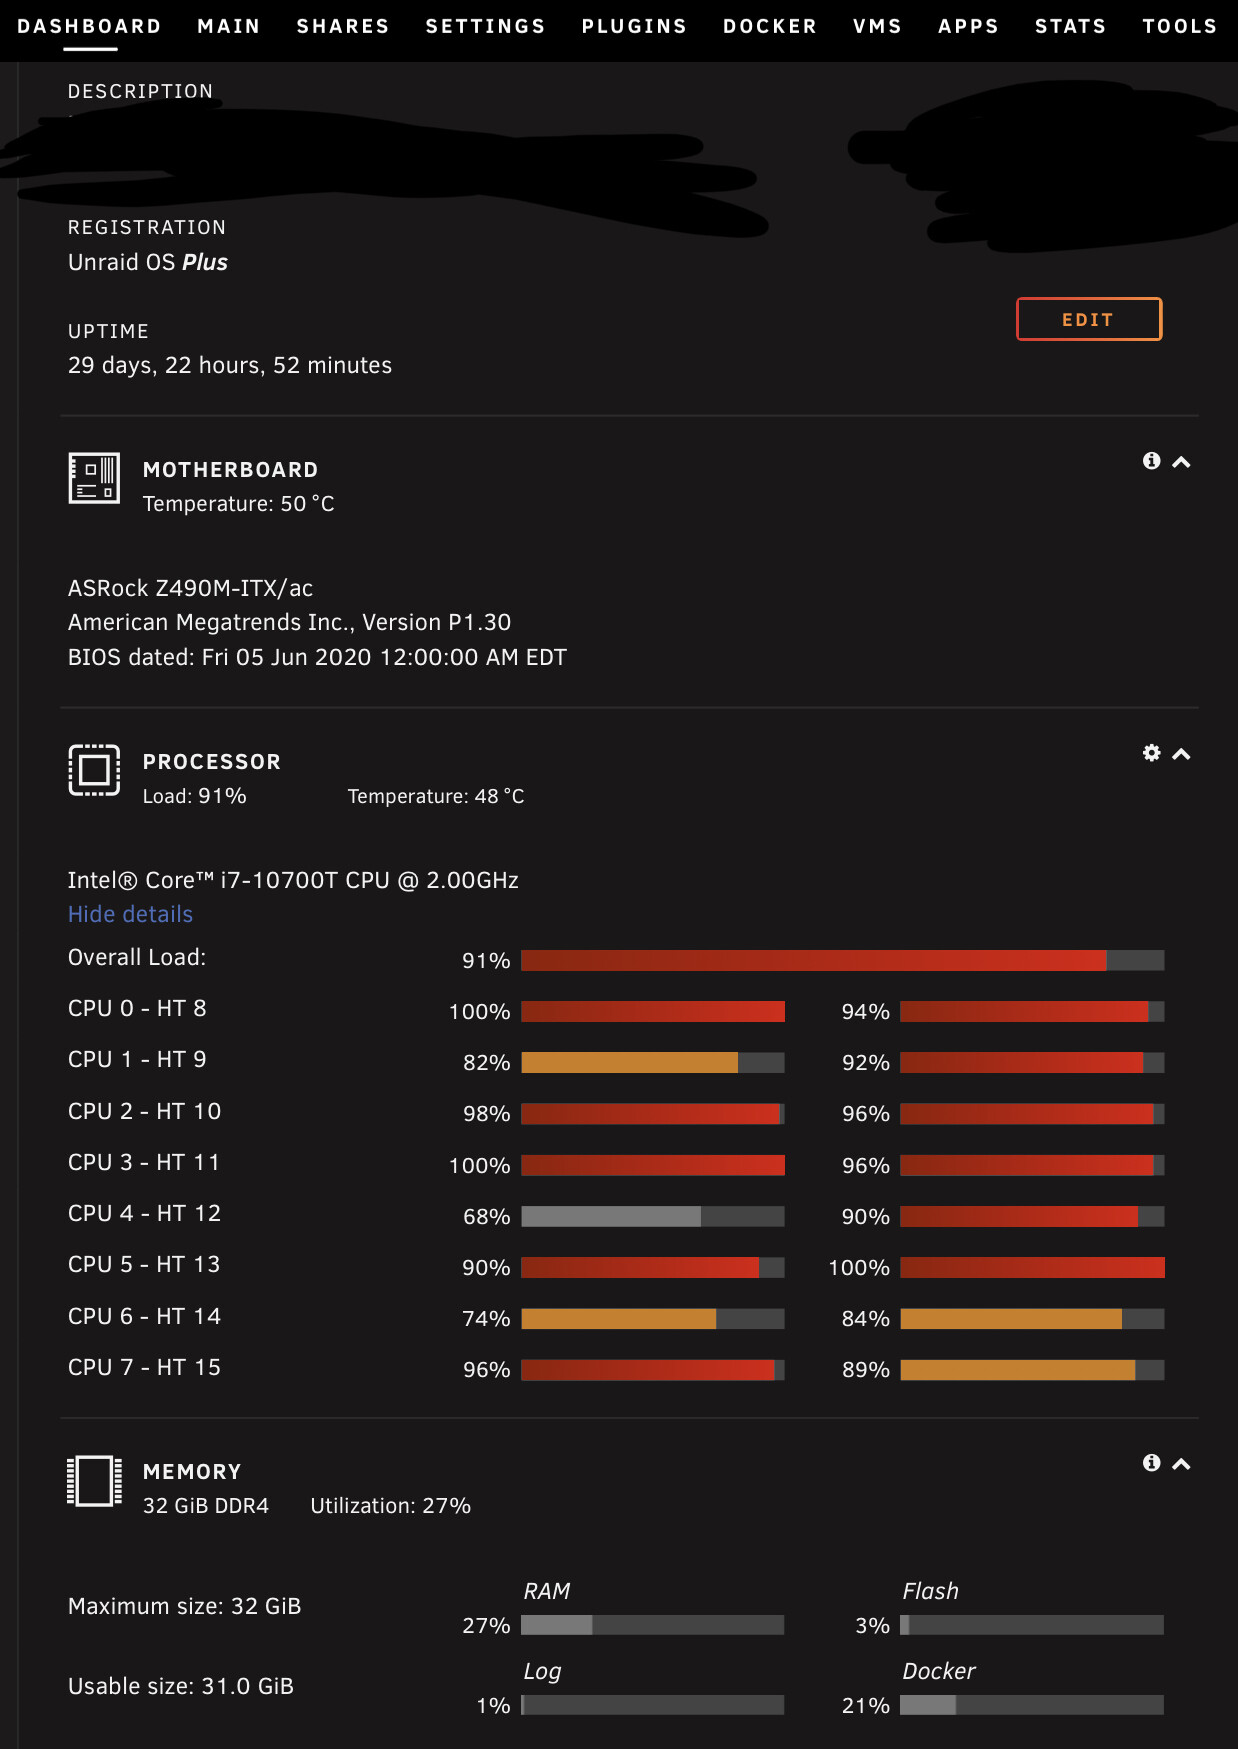
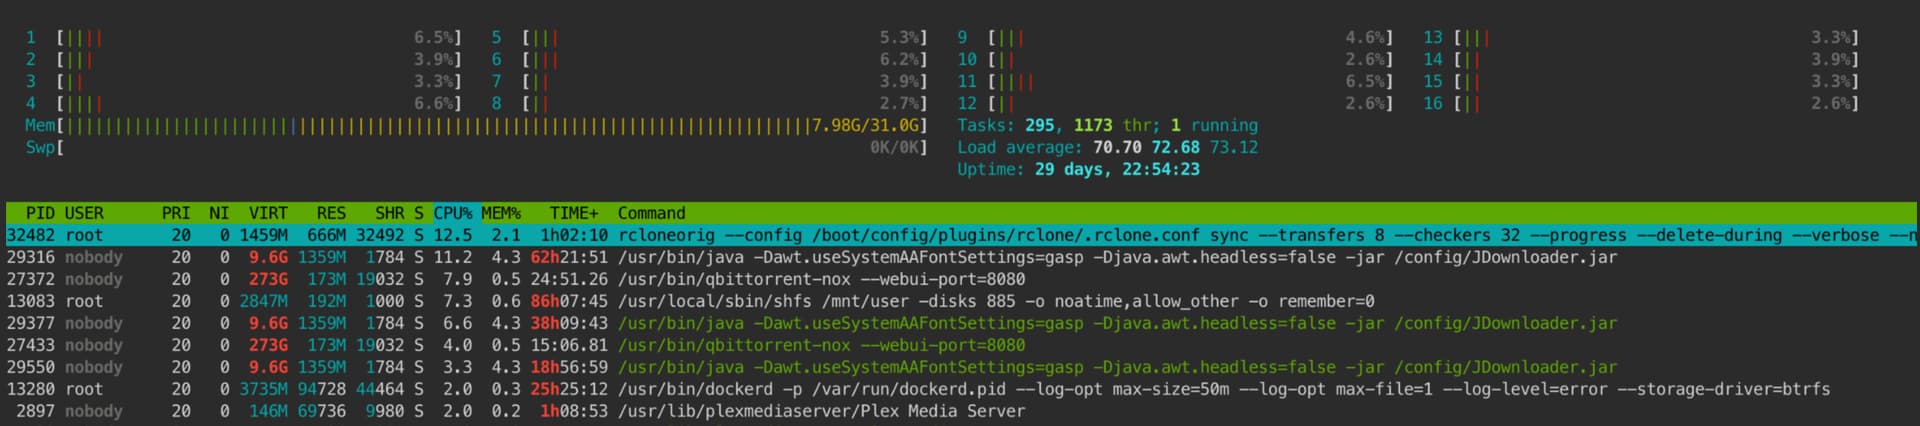
I moved over from Windows to Unraid and installed the rclone plugin and now run all my rclone commands via unraid web terminal. I used to run 16 transfers 32 checkers on that 2012 desktop windows installation, and here I’m running 4 transfers / 16 checkers and it’s causing 100% usage on Unraid, which makes accessing any other docker containers running on my Unraid build basically unusable. Alongside this, the upload speed is pitiful at ~5MB/s. I am able to download files from my GD to the local array at saturated gigabit speeds, but upload performance seems to be quite horrendous as well as CPU usage extremely high. RAM seems okay.

Any idea what i can do to fix this? I would like to first optimize my rclone command running via Unraid web terminal so it isn’t just max’ing my CPU for days while trying to upload a few TB of files and also optimize my upload speed. See below for some pictures of usage.


Run the command 'rclone version' and share the full output of the command.

rclone v1.58.0-beta.5930.b4ba7b69b
- os/version: slackware 14.2+ (64 bit)
- os/kernel: 5.10.28-Unraid (x86_64)
- os/type: linux
- os/arch: amd64
- go/version: go1.17.6
- go/linking: static
- go/tags: none

Which cloud storage system are you using? (eg Google Drive)

Google Drive

The command you were trying to run (eg rclone copy /tmp remote:tmp)

rclone sync --transfers 8 --checkers 32 --progress --delete-during --verbose --no-update-modtime --contimeout 60s --timeout 300s --retries 3 --low-level-retries 10 --drive-chunk-size=64M --drive-upload-cutoff=64M --stats 1s --stats-file-name-length 0 --fast-list --drive-acknowledge-abuse "/mnt/user/Personal" "GD:GD/Personal"

The rclone config contents with secrets removed.

[GD]
type = drive
client_id = xxx.apps.googleusercontent.com
client_secret = xxx
token = {"access_token":"xxx","token_type":"Bearer","refresh_token":"xxx","expiry":"xxx"}

hi,
not sure what the exact issue is but best to test the latest stable, v1.57.0

Reverted to 1.57, still same issue on resource usage

so unraid is installed on the same computer that used to run windows?

No, completely different computer. Windows was running on a 3rd gen quad-core Intel / 8GB RAM / USB-3.0 external enclosure (5x8TB HDDs) while Unraid is running on my new server: Intel Core 10th gen i7 (8 cores / 16 threads), 32GB RAM, 8x8-16TB drives all connected directly to SATA on mobo.

Also - I just installed rclone browser on a Windows 11 VM on my Unraid server, and running the same command - it shows approximately the same upload performance (each file is uploading at ~2MB/s; checkers are running very slowly) but CPU resources is significantly less while RAM usage is high (since I've spun up a VM)

C:\[...]\Install (BETA)\rclone.exe --config C:/[...]/rclone.conf sync --delete-during --verbose --no-update-modtime --transfers 8 --checkers 32 --contimeout 60s --timeout 300s --retries 3 --low-level-retries 10 --drive-chunk-size=64M --drive-upload-cutoff=64M --stats 1s --stats-file-name-length 0 --fast-list --drive-acknowledge-abuse I:\ GD:GD/Personal

--- again, imho, would not use beta software.
--- i would create a set of test folders/files to better comparisons.
--- not use rclone browser.
--- and what is the result of using a very simple command
rclone sync --transfers --checkers 1 --progress --verbose "/mnt/user/Personal" "GD:GD/Personal"

I ran the below command using 1.57.0, and it put about 30% load onto my CPU. It was transferring that one file around ~20MB/s which i guess is faster than the ~5MB/s before.

rclone sync --transfers 1 --checkers 1 --progress –verbose  --no-update-modtime "/mnt/user/Movies" "Alien:The Alien/Movies"

image

Bump - any ideas on how to reduce CPU strain?

Do you have anything else to show what is using the CPU like top or something?

here's me running the function to transfer ~14 files and 8 checkers for ~10GB files each:

image

I just cannot figure out why 8 checkers are causing my CPU to be put on 80-100% load? My checkers also run super slow vs. my old 3rd gen 2012 Windows PC. I moved from Windows to Unraid to remove all the overhead built into Windows system yet I'm getting worse performance / higher overhead in Unraid using less stressful settings

I think there is some confusion.

30% of a 12 core server is just about nothing. You can see you are barely using one core. You have 1200% as it's 100% per core. So 30% is really nothing.

The bottom picture does not correlate with the htop output at all though.

hmm i just installed a new container called "Net Data" which shows a whole lot more info about usage (see below). It looks like HTOP function doesn't include "IOWAIT" while the Unraid dashboard does show that. Either way, it is causing my Unraid machine to slow down when that CPU usage approaches 100% (right now its only 70-80% load so other dockers are usable - again this is with only 8 checkers meaning its taking forever to actually check files. Its been running for 1 hour now and 40 of 2200 files have been checked which is way too slow vs. my old Windows machine was able to breeze through with ~32 checkers).

IOWait means your server is waiting for disk IO to happen.

If the other machine had faster disk, that's probably why it was faster.

Is this slower spinning disk?

No, the other machine actually had the same WD white label drives (5 of them) connected via USB 3.0 external enclosure vs. this unraid machine all of them are connected directly via SATA to the motherboard (so should be quite a bit faster than a USB enclosure i imagine).

Is there a way to reduce IOWAIT? I can run 1 checker which then only puts ~15% load on my CPU, but then its just super slow to complete the entire sync. My machine isn't a slouch as I mentioned the stats above, so I'm just puzzled if maybe my expectations are too high or there is some overhead occurring then maybe I can override (should i skip checksums and do checking based on file-size + date instead? would that help?)

by default, rclone sync compares file size and modtime, not checksum.
for compare by checksum, need to use --checksum and your commands are not using that.

without --checksum
DEBUG : ABP-EN08_V2021-08-09T125148.vib: Size and modification time the same (differ by 0s, within tolerance 100ns)

with --checksum

Checking:
 *               ABP-EN08_V2021-08-09T125148.vib: checking

IOWait is just disk IO waiting be it local disk or remote cloud disk. Not much can be done to speed it up.

Too many transfers make it inefficient and not enough doesn't strain it at all.

felix@gemini:/data$ time md5sum jellyfish-400-mbps-4k-uhd-hevc-10bit.mkv
99a4778625f050d24ecf4e75e1512365  jellyfish-400-mbps-4k-uhd-hevc-10bit.mkv

real	0m10.122s
user	0m2.493s
sys	0m0.461s
felix@gemini:/data$ cp jellyfish-400-mbps-4k-uhd-hevc-10bit.mkv ~
felix@gemini:/data$ cd
felix@gemini:~$ time md5sum jellyfish-400-mbps-4k-uhd-hevc-10bit.mkv
99a4778625f050d24ecf4e75e1512365  jellyfish-400-mbps-4k-uhd-hevc-10bit.mkv

real	0m0.562s
user	0m0.532s
sys	0m0.030s

Top is spinning disk and bottom is SSD. For those 10 seconds up top, you'd see IOWait as the CPU is waiting for the disk to respond.

We're circling a bit as lots of talk, but without a log file, we can't see what is actually going on.

If you CPU % is all IOWait, that points to a storage issue.

I do a lot of movement on data on my system and the primary slow point is always when I backup to spinning disk and IO hits at 50% of my system, which is expected.

So if you have 2 servers acting different, something is configured different on one compared to another. The CPU won't matter much as it's disk IO wait.

Are the ports plugged into USB 3.0?

My SSD are on USB 3.0 and my slower disk is not:

/:  Bus 02.Port 1: Dev 1, Class=root_hub, Driver=xhci_hcd/6p, 10000M
    |__ Port 3: Dev 2, If 0, Class=Mass Storage, Driver=uas, 5000M
/:  Bus 01.Port 1: Dev 1, Class=root_hub, Driver=xhci_hcd/16p, 480M
    |__ Port 1: Dev 2, If 0, Class=Mass Storage, Driver=uas, 480M
    |__ Port 3: Dev 3, If 0, Class=Mass Storage, Driver=uas, 480M

Sorry to be clear, there are no USB drives in the current server experiencing the slow issues (disks are all plugged in directly to the server via SATA3 interface). I will need to travel back to my parents house to retrieve that old server so I can compare both logs side by side when doing the same action. I'm trying to output my current sync (which is checking-only right now) using the below command but when i open up the generated .txt file from either Krusader or Windows, it says I do not have permission. What command should i add to the below so i can paste my log for you guys to see?

rclone sync --transfers 8 --checkers 16 --progress --delete-during --verbose --no-update-modtime --contimeout 60s --timeout 300s --retries 3 --low-level-retries 10 --drive-chunk-size=64M --drive-upload-cutoff=64M --stats 1s --stats-file-name-length 0 --fast-list --drive-acknowledge-abuse --log-file /mnt/user/Other/Logs/rclone_date +%F_%T.%3N.txt "/mnt/user/Personal" "GD:GD/Personal"

By the way - i really appreciate the time you are taking to help me with this. It's immensely appreciated :slight_smile:

Not related to your issue, but I realized I had my 2 USB HDs plugged into the slower ports by mistake.

/:  Bus 02.Port 1: Dev 1, Class=root_hub, Driver=xhci_hcd/6p, 10000M
    |__ Port 1: Dev 2, If 0, Class=Mass Storage, Driver=uas, 5000M
    |__ Port 3: Dev 3, If 0, Class=Mass Storage, Driver=uas, 5000M
    |__ Port 4: Dev 4, If 0, Class=Mass Storage, Driver=uas, 5000M

Literally tripled my speeds albeit it's only archive disk anyway but none the less, it was a good improvement.

You can use pastebin or any shared file link like Google Drive and just share the link to the file.

Also while running the current command - using 16 checks; you can see IOWAIT is nearly max'ing my CPU while the disk (disk #2 houses like ~90% of the sync files) is being read at ~110MB/s. Something seems off that checks are so slow yet the read speeds on the disk are max'ing out. I guess we can check further once I get the log uploaded. Let me figure out how to get the right permissions on unraid so i can even view the log file. is the above command i posted okay in terms of the log or do you need a DEBUG specific log?

That all seems pretty normal to me.

Busy disks == High IOWait. More checkers == more IO.

I'm unrarring some things now and I chilling at 50% as it's all waiting for IO:

image

I use iotop as well as you can see what's making the disk "busy"

In my case, I'm writing data so it buffers up and flushes it making my disk I'm writing to 100% utilized which to the system is all IOWait from the CPU's perspective.