I have tested this on more than one machine and more than one distribution with the same end-results so it's definitely a common problem and not machine-specific.
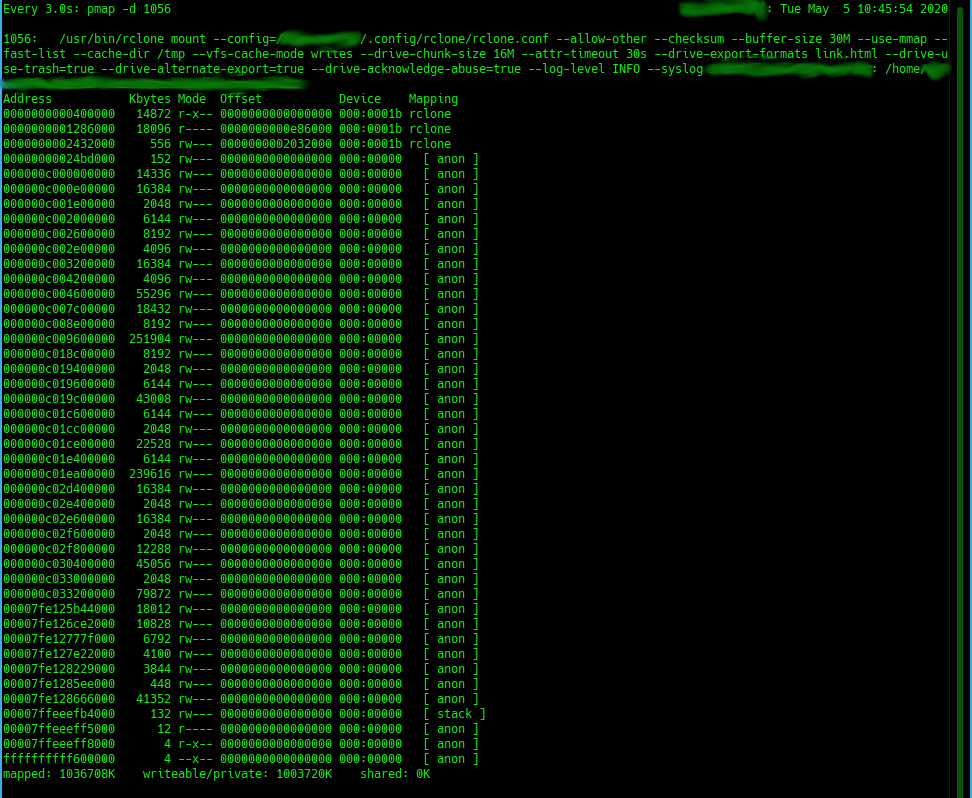
I have been monitoring an rclone mount (see the screenshots) over a number of hours and days as I found that it always starts using the same amount of memory (about 137K) when initially loading and then steadily keeps using more memory over the monitored timeframe.
This happens with or without any usage of the mount during the same timeframe. In the instance shown in the screenshots the machine was booted and other apps were used but the mount was never accessed at all.
The RAM usage can easily grow in size to over 4GB after a day or two of uptime.
I recently changed the log-level from info to debug to see if I can ascertain what was happening with the mount during this time and this has shown that even without the mount being used or accessed since bootup its still actively busy enumerating all the folders in the mounted GDrive. It looks like its busy scanning the full directory tree. This is a 48TB drive with millions of files.
So what I'm now starting to think is that perhaps there is no memory leak but rather as the folder enumeration continues its using systematically more memory to store the scanned information. Can this be the case?
My understanding is that rclone accesses and fetches info from GDrive only when you are actually traversing a particular directory tree and that it only fetches enough info into the local cache to satisfy the current browsing requests? Am I wrong? How do I prevent the automatic folders enumeration?
I am essentially trying to have a readily available GDrive mount that will only retrieve what is being used at a particular point in time and then free those resources as soon as they are no longer actively being used by any application. Basically like Google File Stream for Linux.
A rclone mount by itself doesn't access anything. The applications you have running on top of it make the requests to the mount and the mount fulfills those requests.
If you list a directory, it gets that directory and returns the results. If you enumerate that directory via f ind or something and list recursively, it will list grab all the contents.
I specifically cache my structure in my memory once mounted by doing:
/rclone rc vfs/refresh recursive=true
as that uses fast list and finishes much faster than manually doing a find and listing.
How are you seeing that? I normally sit at a few hundred MB when it's been up for days if no one is doing anything.
If you do think you have a leak, you can follow this to collect the info needed.
Yeah that's what I thought as well but that's why I was testing it. Only one app was used during the monitored time - Chrome - so no file access, saves or finds on the mount and yet looking at the syslog with debug on I could see rclone is constantly busy traversing through the folder structure. It started immediately after boot already. That's exactly what's puzzling me...
I see the exact memory consumption as per my attached screenshot (sorry I actually have a whole set of them to show growth over time and the additional sub-processes spawned but I am only allowed to upload one). I am using pmap with the relevant process number to see the consumption.
I will have a look at your memory caching suggestion, thanks, but I don't think it's going to address the traversing issue?
I rebooted the machine now to free all processes and have started monitoring pmap, lsof and syslog all to see if I can ascertain what triggers the traversing and the growth of the [anon] sub-processes. Other than the terminal I'm not opening any other apps. It can be anything from a couple of hours to a day or two before I have any useful info so will report back at that stage.
So far rclone is just checking any GDrive changes every 30 seconds and nothing else. In the past I usually only started experiencing a noticeable memory growth after a couple of hours anyway.
Thanks . Yeah getting to grips with Go has been on my project list for a while but limited time... I installed it on the other machine that I have running here now to test the memory debugging process in the link you sent and see if that maybe shines a light on something. So I guess I will have to start with Go then
Some feedback on the monitoring and troubleshooting of the cause of both the memory usage growth as well as the Drive enumeration...
So the culprit is locate/mlocate/update.db. In short this is a daily cron job that runs and updates a local DB with basically a file index scan of the files locally and any mounted file systems. It seems to come as part of the default O/S install at least on all the *buntu flavours. Not 100% sure of other distributions but probably is the case as well.
Of course in this scenario rclone mount counts as one of those mounted file systems and when the cron job kicks off it also indexes GDrive - all 48TB of it or at least tries to. And the longer it goes on the larger the amount of RAM allocated to the rclone process grows.
The easy way to fix it is simply to "chmod -x /etc/cron.daily/mlocate" which will disable the cron job from running. Only do this though if you do not use the locate command to find files on your computer.
If you still want to continue using locate then you can add the rclone mount path to an exclusion list for the cron database update by changing the configuration parameters of "prunepaths" in the "/etc/updatedb.conf" file.
So hopefully this will help at least all *buntu users who are mounting large GDrive volumes and experiencing exponential RAM usage over a couple of days' uptime
I don't think rclone should be increasing in memory size forever so if it there is a memory leak. I think updatedb just looks at every file on the disk and doesn't read it. Or maybe it does - it is certainly very hard on the disks.
Can you reproduce this with, lets say find - if you run that does it increase in memory each time?
Nick I am busy running this search but it's already been going for longer than 24 hours due to the size. I will confirm the final results once it's done but what I can report back on sofar:
Memory growth is 100% inline with what was seen under the updatedb enumeration. It's currently standing at 2.3GB allocated. For at least the first 18 hours after starting the search there was very little growth in RAM allocated and then its seems to hit a threshold where it starts increasing quickly from thereon.
The longer the search continues the more processes rclone spawns - its currently up to 23
Go is cleaning up memory after itself. Its own memory usage hasn't increased beyond 670MB
I want to see:
If the RAM usage will topout somewhere
Once the search completes if the allocated memory blocks are released back to the system (and how long it takes). From what I have seen in previous tests rclone will hold onto the memory blocks even after completing its tasks until the system is rebooted.
Hi random404. Do you care to share your rclone mount command parameters so I can compare what it looks like and where it differs? I have some mounts on Ubuntu servers as well and those tend to grow up to about 3.3GB and then stays there. It's not traversing any directories but it is uploading large files (2-20GB) to the same directory the whole time so I am assuming that it's the file size that's causing the growth. I have not really done any extensive troubleshooting on those as there's 196GB RAM on the servers so the 3.3 is not really impacting me too much. If I can get it down though it will be great.
Rclone shouldn't be spawning any new processes. It may spawn new threads though - is that what you are seeing? If it has got to 23 that is probably a sign that there is a thread leak.
If you are running with --rc you can just run the commands here: Remote Control / API and it will show you the goroutines. Can you paste them for me to see somewhere?
Nick you are correct - 23 threads and not processes. I just looked at unique PIDs and assumed them to be new process. After checking though I can confirm they are threads:
pstree -pau -l -G -s 1500
systemd,1 splash
└─rclone,1500,xxx mount --config=/xxx/rclone.conf --rc --allow-other --checksum --buffer-size 30M --use-mmap --fast-list --cache-dir /tmp --vfs-cache-mode writes --drive-chunk-size 16M --attr-timeout 30s --drive-export-formats link.html --drive-use-trash=true --drive-alternate-export=true --drive-acknowledge-abuse=true --log-level DEBUG --syslog gdrive: /xxx
├─{rclone},1520
├─{rclone},1521
├─{rclone},1522
├─{rclone},1523
├─{rclone},1524
├─{rclone},1569
├─{rclone},1570
├─{rclone},1681
├─{rclone},1682
├─{rclone},1683
├─{rclone},1729
├─{rclone},1733
├─{rclone},1765
├─{rclone},2957
├─{rclone},2958
├─{rclone},2959
├─{rclone},2960
├─{rclone},2998
├─{rclone},6005
├─{rclone},7822
├─{rclone},8017
└─{rclone},9304
I executed the commands you asked for. I couldn't attach the file but here is a link to grab the .zip.
What it looks like is that you've got a lot of VFS objects in memory.
How many files do you have in your mount? (rclone size remote:)
I guess updatedb has pulled the metadata for all of them into memory - that is why it is using so much memory. You can reduce
--dir-cache-time duration Time to cache directory entries for. (default 5m0s)
To make rclone get rid of those directory entries quicker. Though I think (looking at your command line) that you have it at the default 5 minutes already - is that correct?
So maybe the VFS layer isn't pruning its directory cache properly...
I'm not quite sure exactly where all the memory come from but some of that usage doesn't look very efficient!
Can you do
go tool pprof -svg http://localhost:5572/debug/pprof/heap
And post the generated svg file - that should show the trace of where the memory got used. That will also generate a .gz file - if you could stick that in the archive too then I can run my own analyses - thanks.
Busy doing the size scan but it will take some time - >million. I will report back as soon as I have a figure.
updatedb has been completely disabled as i prefer using alternative methods to using locate for file searches. So whatever memory has been consumed in this test is exclusively due to running a manual find against the mount.
Yes, I am just using the default 5 minutes for --dir-cache-time as I am not explicitly setting another value. That being said what I am explicitly setting is the --cache-dir to /tmp which of course means that every time the system is rebooted it cleans out all the cache files. I specifically did it this way to keep the system clean and force a full fresh read of the directory structure after reboots but on second thought it may be part of the issue as rclone has to rebuild that cache every time for a rather large mount point. If the mount point was smaller it would not have been an issue but I will make a change to this and see if there is any noticeable improvements over time.
I had to restart the machine as the find was running for 3 days already and I had to make changes to the hardware. Will start another find over the weekend and let it run and then do the dump to give more accurate results given the problem.
Let's say that you have 1 million files, if each file in memory used 2k of RAM that would be a about the 2GB of memory that you are seeking...
I did a quick test myself - I made 1 million files locally and mounted them. vfs/refresh used 880M of memory and doing a find used 1.8GB of memory.
So maybe what rclone needs here is to be limiting the total size of the in memory vfs cache...
Though I'm not sure why you've got so many directory entries with a 5 minutes cache timeout so that is a mystery which needs solving.
OK. Running rclone rc vfs/refresh recursive=true will have much the same effect (filling up the vfs cache) and will be much quicker than running find.
I don't think you are using the cache backend - the vfs layer doesn't store any metadata in the cache directory (yet) so I don't think this will be the problem.
Honestly the search function in GDrive webui is the fastest way of finding anything so I won't use the mount to find stuff.
The mount is a convenience factor to be able to get direct access with local applications to individual files and folders to complete work without having to first download it through the webui, then work on it and then re-upload it.
The other use is to navigate the Drive folders with the much easier to use features/functions and tree structure in Dolphin compared to the webui (especially if you have a deeply nested structure then the webui sucks).
Everything else can be done directly in the webui itself.
So I am trying to get the rclone parameters tuned optimally for the above use case and without the huge memory impact. Turning updatedb off made all the difference with the RAM usage as rclone is now only fetching what it needs and not the entire tree structure any longer. I do agree with you that using rclone with a large data store does seem to be having some unexpected quirks which can hopefully be eliminated with fine tuning so I will keep on testing different configurations accordingly.
A second use case is for rclone to use a mount for real-time syncing of large/many files to Drive instead of it requiring a lot of local storage space first and then doing a rclone sync to Drive. This is a compelling option for VMs as you can keep the VM storage requirements down but still have seamless access to petabyte connected storage. The RAM usage is again an issue here as you don't want to have to give each VM a huge chunk of RAM just so that rclone can do its thing. So if there is a way to cut the RAM footprint whilst still maintaining the use case requirements then it will be ideal.
So does using rclone without updatedb bring the memory usage back down to acceptable?
How many files will the VMs be accessing at any one time do you think? I guess that is the limiting factor provided the directory cache expiry is working....
Actually I just realised where the problem is! The VFS directory cache marks directories as expired when the --dir-cache time expires, but it doesn't remove them from memory as it re-uses the objects in them when the directory is refreshed - that is why your memory usage was never going down.
So what I could do is every now and again, run through the directory tree and prune directories which have expired (or maybe at some multiple of the expiry time). Maybe I should only do that when the tree has more than 100,000 entries say.

 . Yeah getting to grips with Go has been on my project list for a while but limited time... I installed it on the other machine that I have running here now to test the memory debugging process in the link you sent and see if that maybe shines a light on something. So I guess I will have to start with Go then