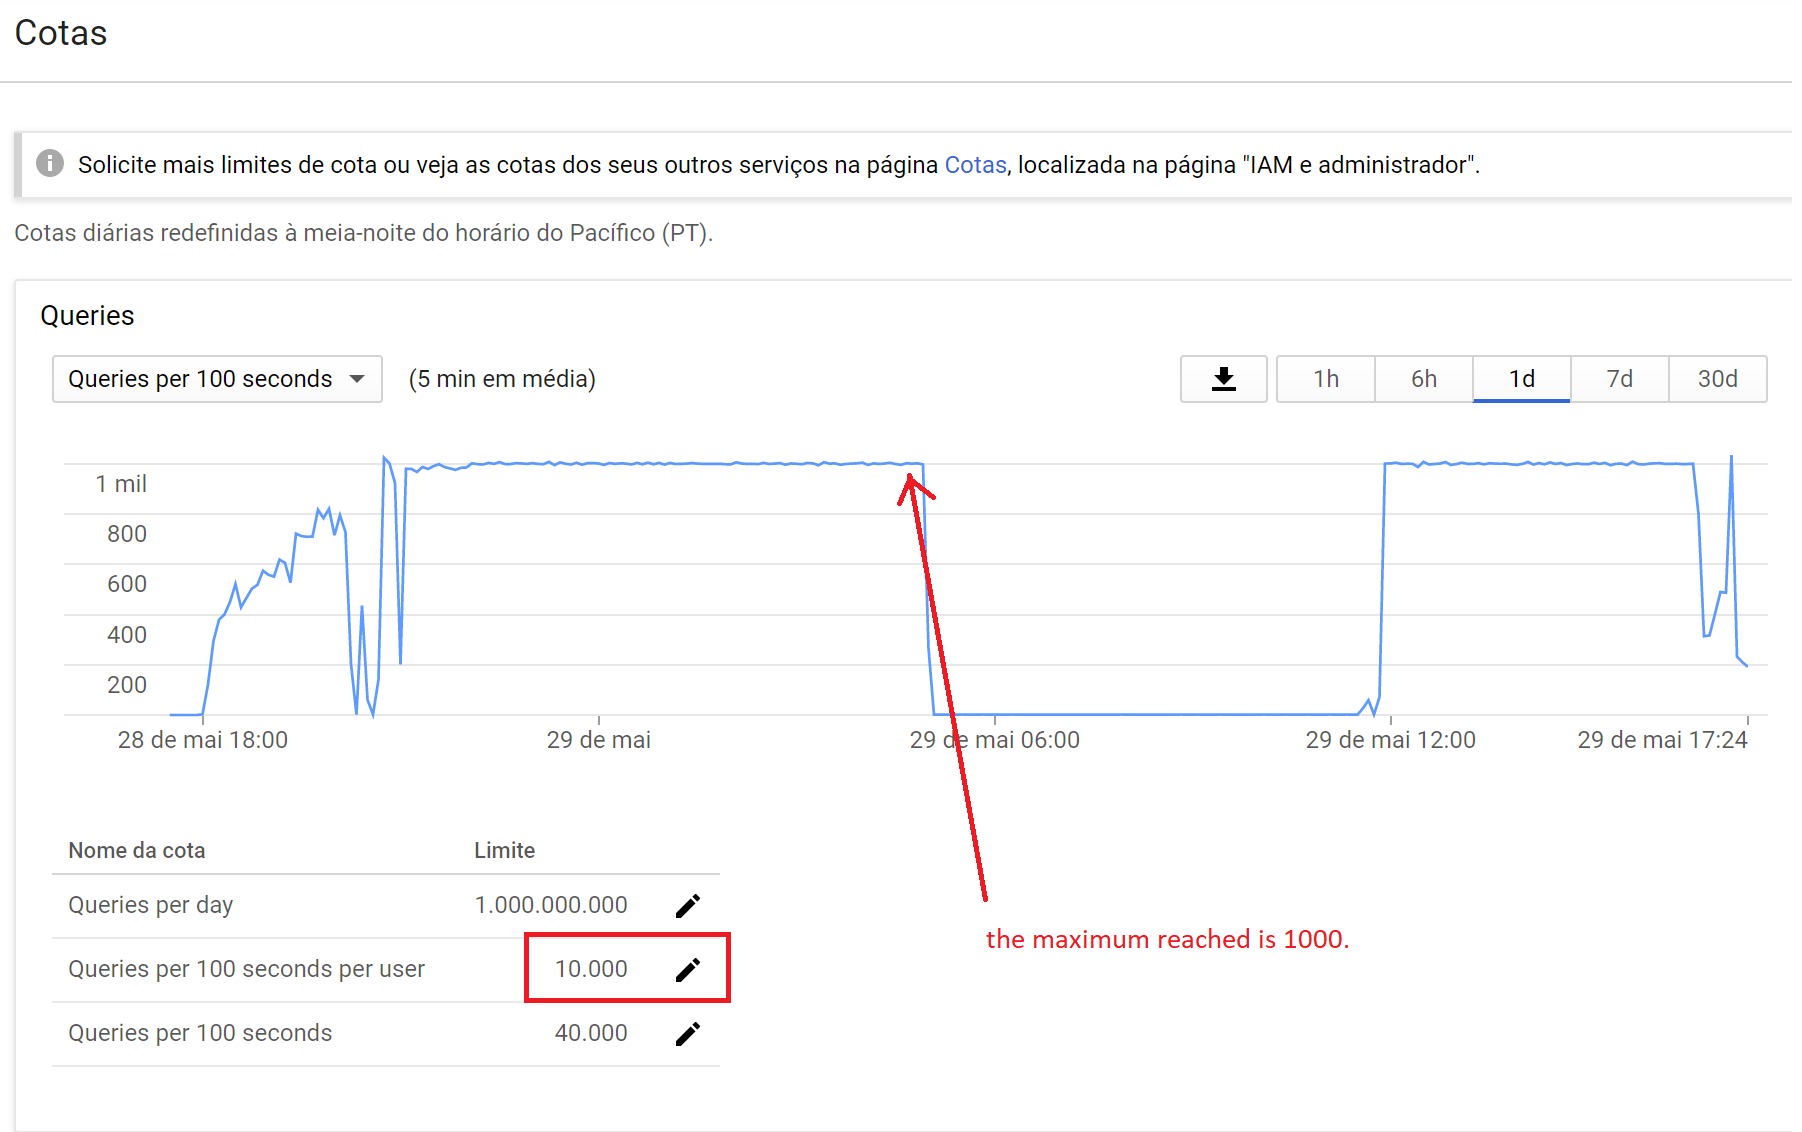
I asked to google to increase the "queries per 100 seconds per user" from 1000 to 10000. They increased but the maximum I still reach using the rclone is 1000 as you can se the graph bellow.
Is there a flag or are there something limiting the queries in the rclone app?
I have a lot of small files to upload to gdrive. So the speed is very slow.
There's nothing limiting it to a max transactions. there is drive-pacer-sleep-time which contributes to how much it will sleep between each transaction and the tps-limit which if unset is unlimited.
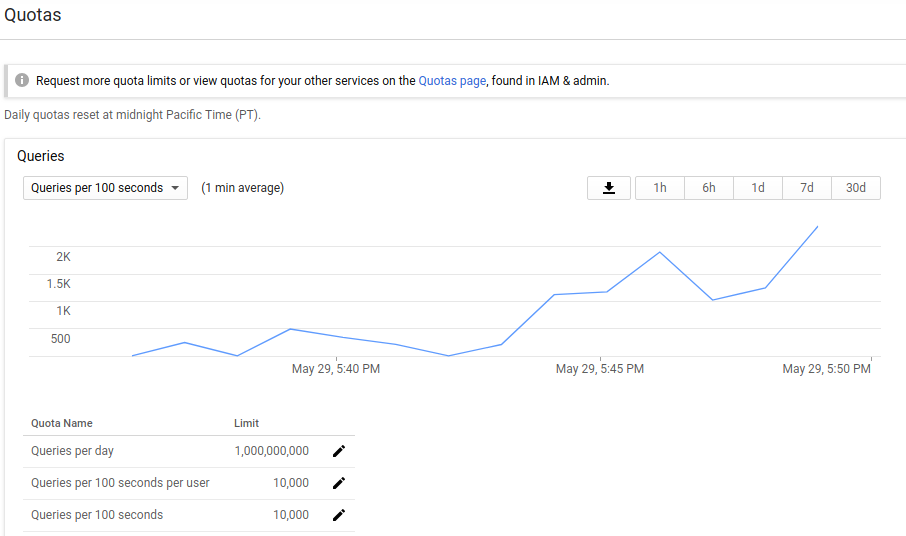
Even if I try really hard, its difficult to get too far above that 1000 as you can see here. But it is odd that your screen looks to 'max' at 1000. If I run in a loop two rclone size commands, which tend to be pretty agressive listing commands, I get up around 2500.
rclone doesn't limit to 1000 hits per 100 second. That graph is a hard stop at 1000 in your screen. Looks like the limits haven't taken affect or something else is involved. My screenshot demonstrates that.
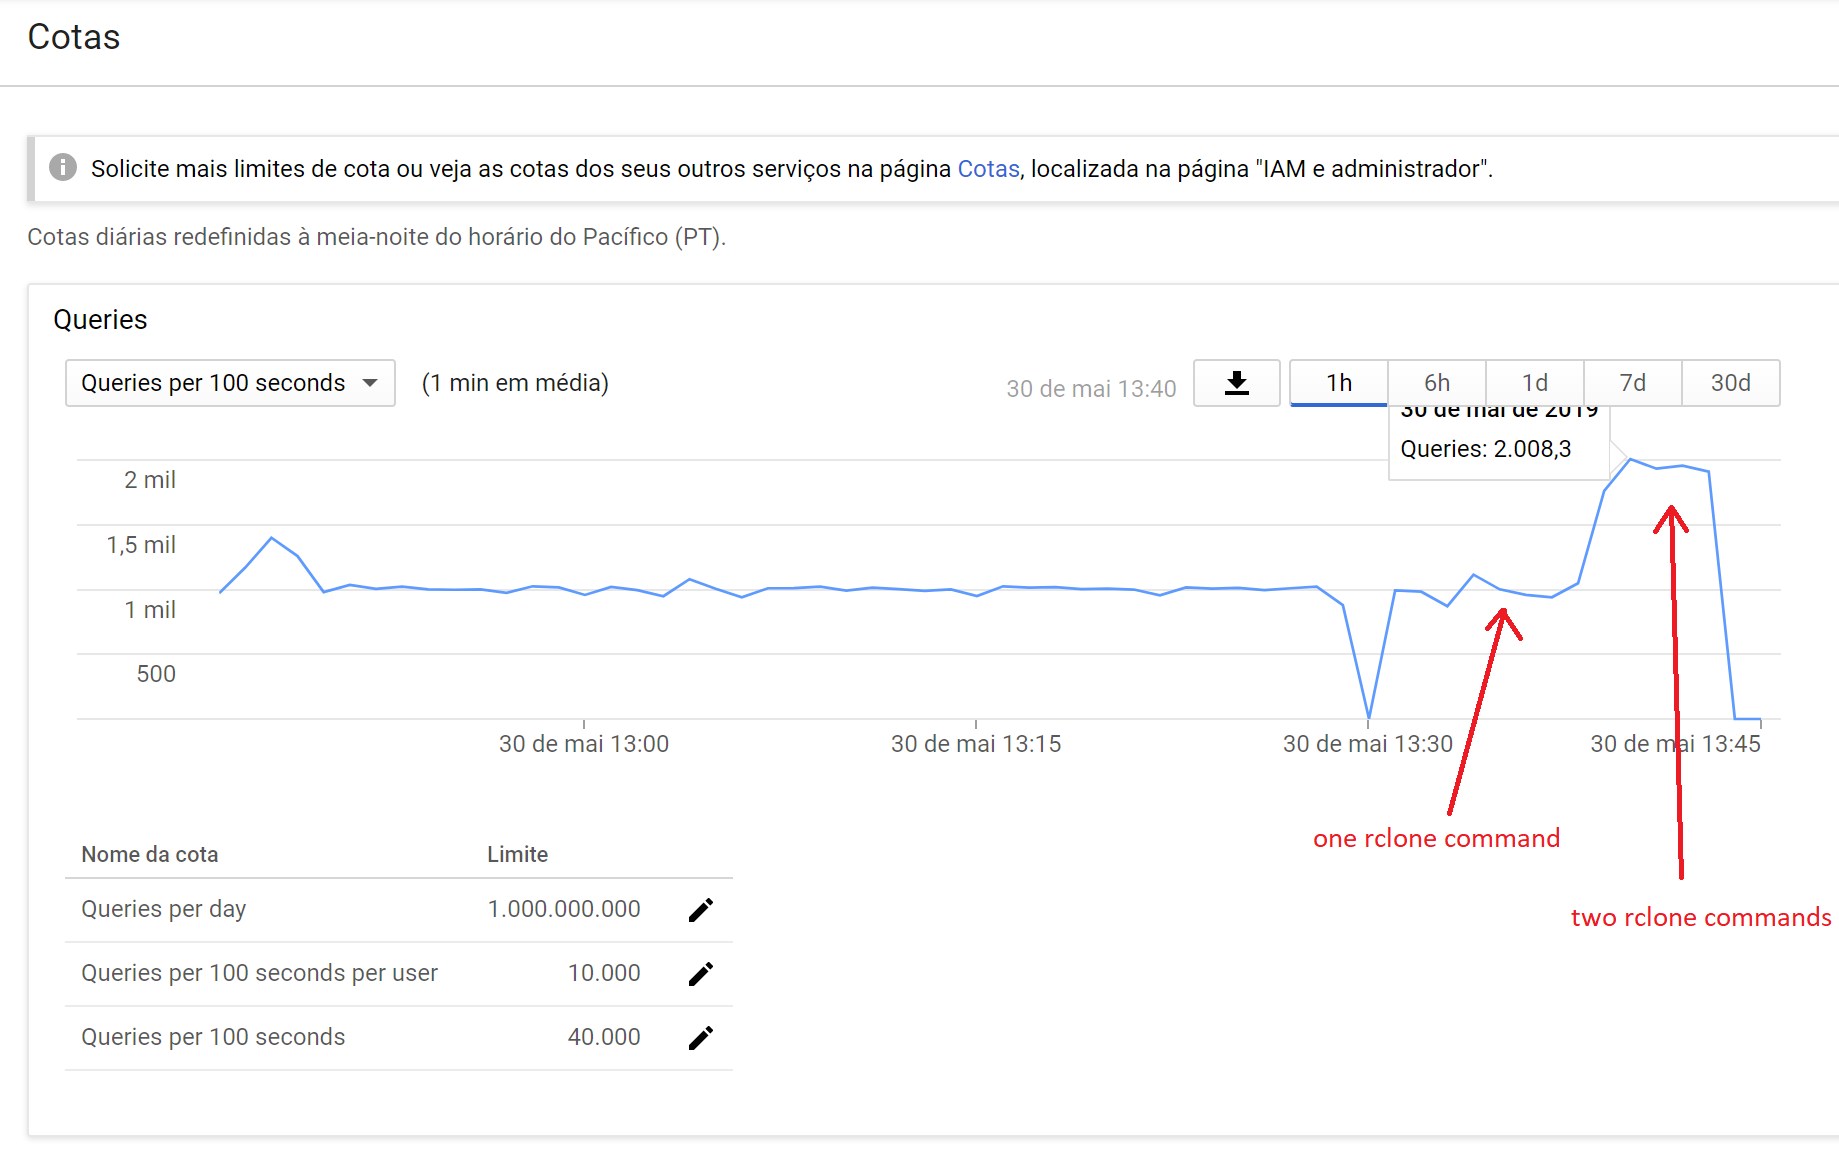
I open a terminal and enter the command "rclone size gdrive:folder -v -P --checkers 32 --transfers 16" and so I get 1000 limit in the graph. I open another terminal and enter the same command in parallel I get 2000 limit in the graph. It seems to be a rclone limit by command.
You will see the default is 100ms which equates to the 1000 you're seeing. That default was decided based on the issue I posted above. Most people don't have 10,000 limit on per user/100 seconds. You'd want to, as @Animosity022 said, to modify the min sleep if you want to increase performance up to your limits.
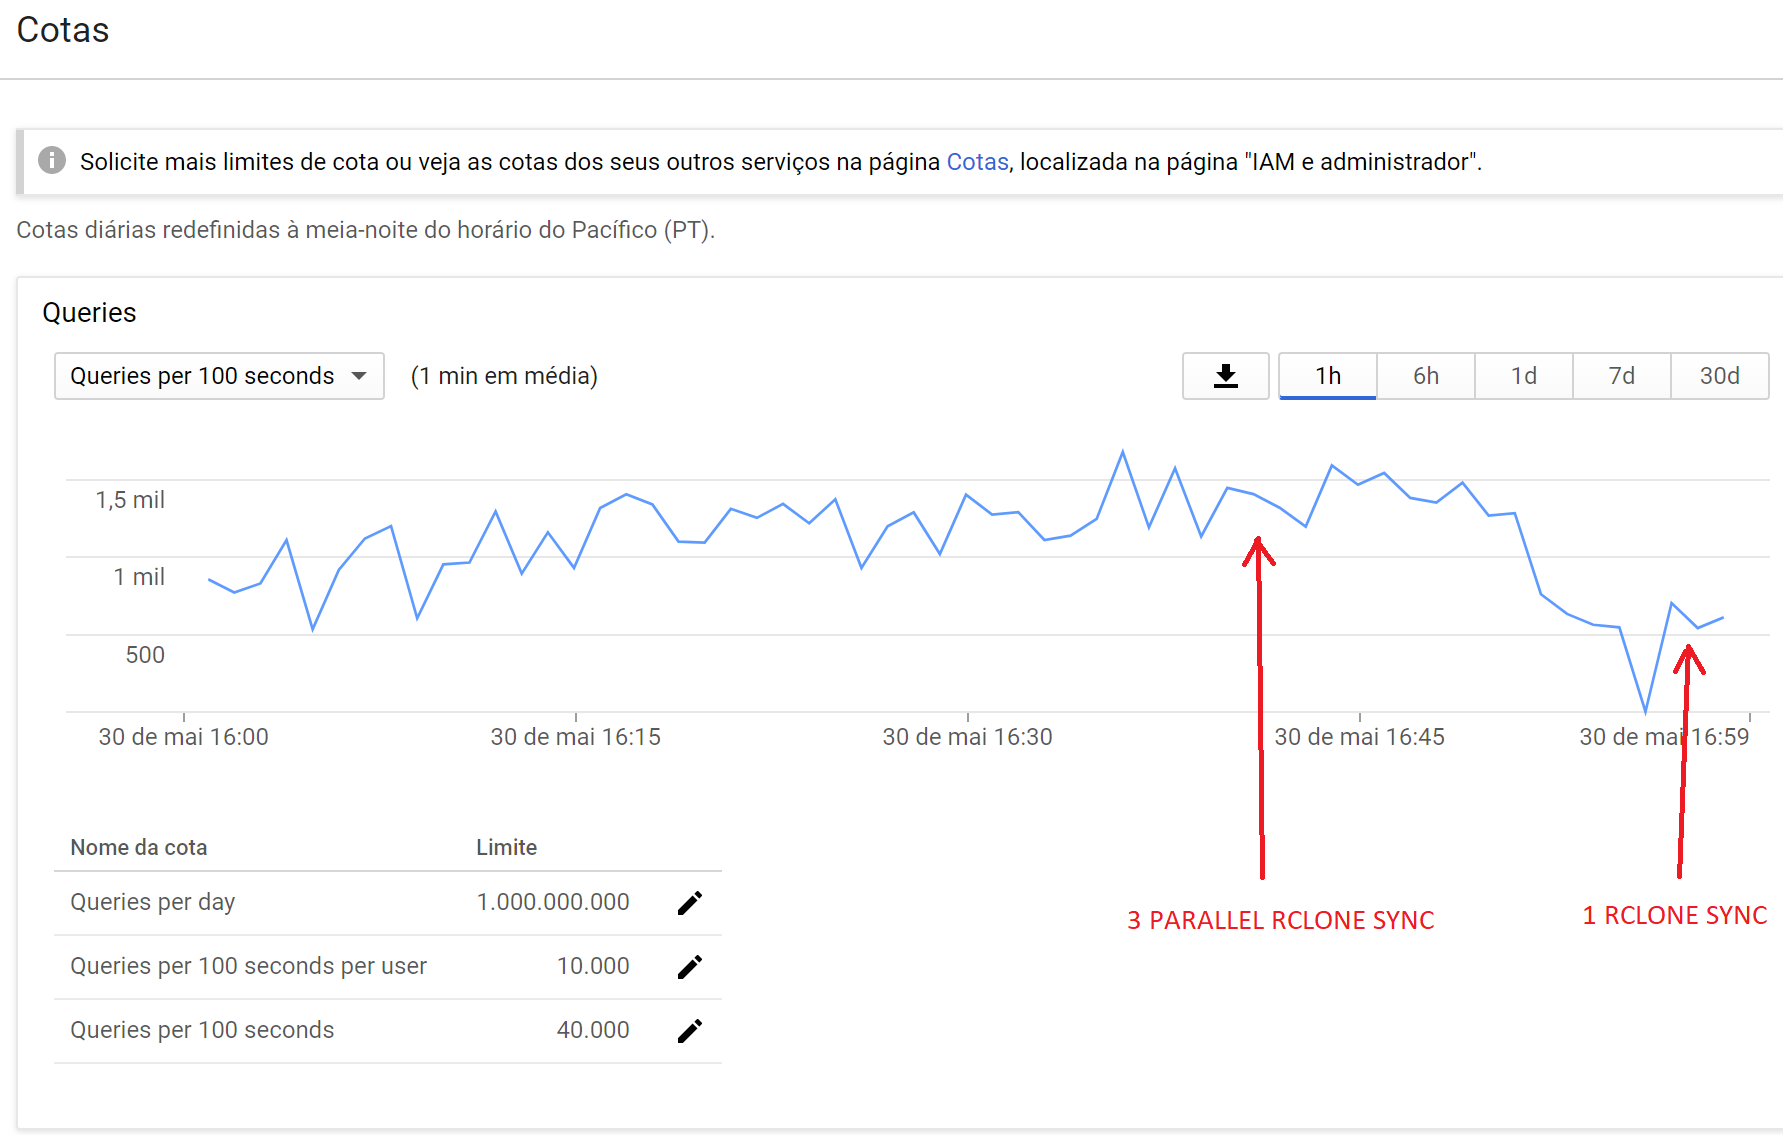
I did "rclone sync" using "--drive-pacer-min-sleep=0ms" with a folder already syncked and I get very good performance (see graph).
But when I syncing new files to google drive the performance stays max 1000. Is there because there are a limit that "can only upload 2-3 files at most per second"?
I'd guess so. You could investigate it by adding --dump headers and seeing what is transpiring. But it's going to be busy doing other things when it's transferring data.
I don't understand how you are drawing that conclusion from that graph. 3 parallel you are getting more API hits than one. Seems normal. I wouldn't assume it should be "triple" as there is other things like cpu, io, etc.
Also you've not posted a log so no one knows if you have a debug and if you're seeing exponential backoffs from the API.
Define performance. Because depending on what you're trying to upload and the problem you're trying to fix would vary the answer. Lots of small files? Big files? What are you actually trying to "fix"?
You'll hit a point of diminishing returns when you crank them up too far as you'll see exponential backoffs which will slow you down more than just going a little slower in the first place.