Rclone cache + plex library scan = Incredibly high RAM Usage

What is the problem you are having with rclone?

I have been able to reproduce this in a variety of ways. Right now I have rclone mounted using some of Animosity022's scripts (much older versions of them).

When I play files directly back from the cache mount, the ram usage is normal/minimal ~1 - 2 GB. When I scan my library however, I end up getting something that looks like this::

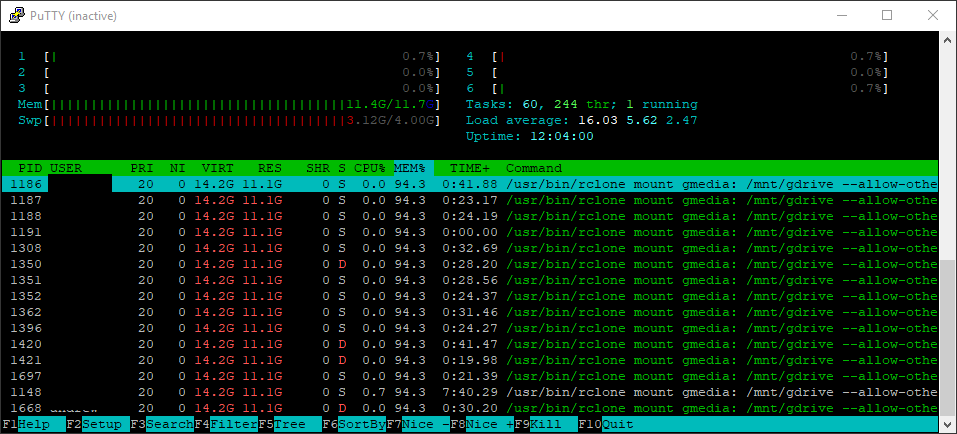
which eventually causes my guest VM to lockup, and then subsequently locks up all the other guests and host (to some extent). I am trying to find ways to optimize this or have a hard cap at the amount of RAM rclone takes up, is there any suggestions on how to improve this?

What is your rclone version (output from rclone version)

@plex:~$ rclone version
rclone v1.49.2
- os/arch: linux/amd64
- go version: go1.12.9

Which OS you are using and how many bits (eg Windows 7, 64 bit)

Ubuntu 18.04.3, 64-bit

Which cloud storage system are you using? (eg Google Drive)

Google Drive/Team Drives

The command you were trying to run (eg rclone copy /tmp remote:tmp)

Was using caching server, the systemd scripts are as follows:

user@plex:/etc/systemd/system$ grep ^ /dev/null gmedia*
gmedia-find.service:[Unit]
gmedia-find.service:Description=gmedia find
gmedia-find.service:PartOf=gmedia.service
gmedia-find.service:After=mnt-gdrive.mount
gmedia-find.service:
gmedia-find.service:[Service]
gmedia-find.service:Type=simple
gmedia-find.service:
gmedia-find.service:ExecStart=/usr/bin/rclone rc vfs/refresh recursive=true
gmedia-find.service:RemainAfterExit=yes
gmedia-find.service:User=user
gmedia-find.service:Group=user
gmedia-find.service:
gmedia-find.service:[Install]
gmedia-find.service:# Components of this application should be started at boot time
gmedia-find.service:WantedBy=gmedia.service
gmedia-rclone.service:[Unit]
gmedia-rclone.service:Description=RClone Service
gmedia-rclone.service:PartOf=gmedia.service
gmedia-rclone.service:
gmedia-rclone.service:[Service]
gmedia-rclone.service:Type=notify
gmedia-rclone.service:#Environment=RCLONE_CONFIG=/opt/rclone/rclone.conf
gmedia-rclone.service:Environment=RCLONE_CONFIG=/home/user/.config/rclone/rclone.conf
gmedia-rclone.service:
gmedia-rclone.service:ExecStart=/usr/bin/rclone mount gmedia: /mnt/gdrive
gmedia-rclone.service:--allow-other
gmedia-rclone.service:--dir-cache-time 96h
gmedia-rclone.service:--drive-chunk-size 16M
gmedia-rclone.service:--log-level DEBUG
gmedia-rclone.service:--log-file /var/log/rclone.log
gmedia-rclone.service:--timeout 3h
gmedia-rclone.service:--umask 002
gmedia-rclone.service:--rc
gmedia-rclone.service:
gmedia-rclone.service:ExecStop=/bin/fusermount -uz /mnt/gdrive
gmedia-rclone.service:Restart=on-failure
gmedia-rclone.service:User=user
gmedia-rclone.service:Group=user
gmedia-rclone.service:
gmedia-rclone.service:[Install]
gmedia-rclone.service:WantedBy=gmedia.service
gmedia.service:[Unit]
gmedia.service:Description=gdrive
gmedia.service:After=network-online.target
gmedia.service:Wants=network-online.target
gmedia.service:
gmedia.service:[Service]
gmedia.service:# The dummy program will exit
gmedia.service:Type=oneshot
gmedia.service:# Execute a dummy program
gmedia.service:ExecStart=/bin/true
gmedia.service:# This service shall be considered active after start
gmedia.service:RemainAfterExit=yes
gmedia.service:
gmedia.service:[Install]
gmedia.service:# Components of this application should be started at boot time
gmedia.service:WantedBy=multi-user.target
grep: gmedia.service.wants: Is a directory
user@plex:/etc/systemd/system$ grep ^ /dev/null mnt-gdrive.mount
mnt-gdrive.mount:[Unit]
mnt-gdrive.mount:Description = /gdrive MergerFS mount
mnt-gdrive.mount:PartOf=gmedia.service
mnt-gdrive.mount:After=gmedia-rclone.service
mnt-gdrive.mount:RequiresMountsFor=/data
mnt-gdrive.mount:
mnt-gdrive.mount:[Mount]
mnt-gdrive.mount:What = /mnt/gdrive
mnt-gdrive.mount:Where = /mnt/gdrive
mnt-gdrive.mount:Type = fuse.mergerfs
mnt-gdrive.mount:Options = defaults,sync_read,auto_cache,use_ino,allow_other,func.getattr=newest,category.action=all,category.create=ff
mnt-gdrive.mount:
mnt-gdrive.mount:[Install]
mnt-gdrive.mount:WantedBy=gmedia.service
user@plex:/etc/systemd/system$

A log from the command with the -vv flag (eg output from rclone -vv copy /tmp remote:tmp)

The debug log just shows it scrolling through files. I removed it because it eventually took up 1> GB of space. Happy to provide, but, file exploration doesn't seem like a huge benefit in the log.

That does seem quite a bit odd in terms of memory.

What does "ps -ef | grep rclone" show?

Can you share the memstats too?

rclone rc core/memstats

Before a Library Scan:

plex:~$ ps -ef | grep rclone
user 1198 1 0 14:43 ? 00:00:13 /usr/bin/rclone mount gmedia: /mnt/gdrive --allow-other --dir-cache-time 96h --drive-chunk-size 16M --log-level DEBUG --log-file /var/log/rclone.log --timeout 3h --umask 002 --rc
user 6154 6134 0 16:09 pts/1 00:00:00 grep --color=auto rclone
user@plex:~$ rclone rc core/memstats
{
"Alloc": 20814376,
"BuckHashSys": 1886144,
"Frees": 33928456,
"GCSys": 5595136,
"HeapAlloc": 20814376,
"HeapIdle": 95109120,
"HeapInuse": 37863424,
"HeapObjects": 214346,
"HeapReleased": 94814208,
"HeapSys": 132972544,
"MCacheInuse": 10416,
"MCacheSys": 16384,
"MSpanInuse": 814032,
"MSpanSys": 1245184,
"Mallocs": 34142802,
"OtherSys": 1122616,
"StackInuse": 1179648,
"StackSys": 1179648,
"Sys": 144017656,
"TotalAlloc": 1931788656
}

After a Plex Library Scan:

user@plex:~$ ps -ef | grep rclone
user 1198 1 0 14:43 ? 00:00:19 /usr/bin/rclone mount gmedia: /mnt/gdrive --allow-other --dir-cache-time 96h --drive-chunk-size 16M --log-level DEBUG --log-file /var/log/rclone.log --timeout 3h --umask 002 --rc
user 7863 6134 0 16:45 pts/1 00:00:00 grep --color=auto rclone
user@plex:~$ rclone rc core/memstats
{
"Alloc": 1100574256,
"BuckHashSys": 1899184,
"Frees": 34906450,
"GCSys": 144072704,
"HeapAlloc": 1100574256,
"HeapIdle": 3310829568,
"HeapInuse": 1117175808,
"HeapObjects": 222617,
"HeapReleased": 211984384,
"HeapSys": 4428005376,
"MCacheInuse": 10416,
"MCacheSys": 16384,
"MSpanInuse": 813312,
"MSpanSys": 1245184,
"Mallocs": 35129067,
"OtherSys": 1109576,
"StackInuse": 1179648,
"StackSys": 1179648,
"Sys": 4577528056,
"TotalAlloc": 6327710208
}
user@plex:~$ rclone rc core/memstats
{
"Alloc": 2414664752,
"BuckHashSys": 1899504,
"Frees": 34949289,
"GCSys": 144072704,
"HeapAlloc": 2414664752,
"HeapIdle": 1996791808,
"HeapInuse": 2431213568,
"HeapObjects": 224535,
"HeapReleased": 211476480,
"HeapSys": 4428005376,
"MCacheInuse": 10416,
"MCacheSys": 16384,
"MSpanInuse": 813600,
"MSpanSys": 1245184,
"Mallocs": 35173824,
"OtherSys": 1109256,
"StackInuse": 1179648,
"StackSys": 1179648,
"Sys": 4577528056,
"TotalAlloc": 7647475424
}
user@plex:~$ rclone rc core/memstats
{
"Alloc": 5774303112,
"BuckHashSys": 1901744,
"Frees": 35135632,
"GCSys": 247980032,
"HeapAlloc": 5774303112,
"HeapIdle": 1858895872,
"HeapInuse": 5790302208,
"HeapObjects": 262949,
"HeapReleased": 1858863104,
"HeapSys": 7649198080,
"MCacheInuse": 10416,
"MCacheSys": 16384,
"MSpanInuse": 813312,
"MSpanSys": 1245184,
"Mallocs": 35398581,
"OtherSys": 1107016,
"StackInuse": 1212416,
"StackSys": 1212416,
"Sys": 7902660856,
"TotalAlloc": 18537217936
}
user@plex:~$ rclone rc core/memstats
{
"Alloc": 1098641688,
"BuckHashSys": 1902704,
"Frees": 35202799,
"GCSys": 282615808,
"HeapAlloc": 1098641688,
"HeapIdle": 7607656448,
"HeapInuse": 1115250688,
"HeapObjects": 223873,
"HeapReleased": 1237893120,
"HeapSys": 8722907136,
"MCacheInuse": 10416,
"MCacheSys": 16384,
"MSpanInuse": 813888,
"MSpanSys": 1245184,
"Mallocs": 35426672,
"OtherSys": 1106056,
"StackInuse": 1245184,
"StackSys": 1245184,
"Sys": 9011038456,
"TotalAlloc": 20232525392
}
user@plex:~$ rclone rc core/memstats
{
"Alloc": 1099352968,
"BuckHashSys": 1902704,
"Frees": 35202819,
"GCSys": 282615808,
"HeapAlloc": 1099352968,
"HeapIdle": 7607459840,
"HeapInuse": 1115447296,
"HeapObjects": 244912,
"HeapReleased": 1237893120,
"HeapSys": 8722907136,
"MCacheInuse": 10416,
"MCacheSys": 16384,
"MSpanInuse": 813888,
"MSpanSys": 1245184,
"Mallocs": 35447731,
"OtherSys": 1106056,
"StackInuse": 1245184,
"StackSys": 1245184,
"Sys": 9011038456,
"TotalAlloc": 20233236672
}
user@plex:~$ rclone rc core/memstats
{
"Alloc": 3939048056,
"BuckHashSys": 1903832,
"Frees": 35247704,
"GCSys": 282615808,
"HeapAlloc": 3939048056,
"HeapIdle": 4767809536,
"HeapInuse": 3955130368,
"HeapObjects": 242458,
"HeapReleased": 356081664,
"HeapSys": 8722939904,
"MCacheInuse": 10416,
"MCacheSys": 16384,
"MSpanInuse": 814320,
"MSpanSys": 1245184,
"Mallocs": 35490162,
"OtherSys": 1104928,
"StackInuse": 1212416,
"StackSys": 1212416,
"Sys": 9011038456,
"TotalAlloc": 23371542184
}
user@plex:~$ ps -ef | grep rclone
user 1198 1 0 14:43 ? 00:00:40 /usr/bin/rclone mount gmedia: /mnt/gdrive --allow-other --dir-cache-time 96h --drive-chunk-size 16M --log-level DEBUG --log-file /var/log/rclone.log --timeout 3h --umask 002 --rc
user 7998 6134 0 16:46 pts/1 00:00:00 grep --color=auto rclone
user@plex:~$ rclone rc core/memstats
{
"Alloc": 3939698640,
"BuckHashSys": 1903832,
"Frees": 35247733,
"GCSys": 282615808,
"HeapAlloc": 3939698640,
"HeapIdle": 4767186944,
"HeapInuse": 3955752960,
"HeapObjects": 261281,
"HeapReleased": 356081664,
"HeapSys": 8722939904,
"MCacheInuse": 10416,
"MCacheSys": 16384,
"MSpanInuse": 814320,
"MSpanSys": 1245184,
"Mallocs": 35509014,
"OtherSys": 1104928,
"StackInuse": 1212416,
"StackSys": 1212416,
"Sys": 9011038456,
"TotalAlloc": 23372192768
}

I didn't let it fully finish the scan, as I am not physically in front of the machine, and at this point if it hard locks up (the host, not the guest) I can't regain access to it. Before shutting down the server, the RAM allocation according to htop was around 8 or 9 GB.

Yeah, that seems pretty crazy as something is definitely off there.

Can you check out:

https://rclone.org/rc/#debugging-rclone-with-pprof

@ncw - do you have a better set of steps for information you'd want to see? With a default buffer size, that is a crazy amount of memory being used.

Yes that does indeed look entirely unexpected!

If you could run the pprof and post the graphical output as an image and the text output that hopefully will shed some light!

The goroutine output would be useful too. Sometimes memory leaks are caused by go routine leaks.

@Animosity022 / @ncw

There was/is a log file at some point with debug enabled that contains a stack trace - unfortunately, the one log file I have from rclone is 1GB> so I am having a hard time separating out the files/opening it within a text editor to obtain/see if it is in there.

I do have this however:

Sep 13 20:45:44 plex sh[1155]: Sqlite3: Sleeping for 200ms to retry busy DB.
Sep 13 20:48:09 plex kernel: [ 7835.068749] Plex Media Serv invoked oom-killer: gfp_mask=0x6200ca(GFP_HIGHUSER_MOVABLE), order=0, oom_score_adj=0
Sep 13 20:48:09 plex kernel: [ 7835.068752] CPU: 5 PID: 7483 Comm: Plex Media Serv Not tainted 5.0.0-27-generic #28~18.04.1-Ubuntu
Sep 13 20:48:09 plex kernel: [ 7835.068752] Hardware name: VMware, Inc. VMware Virtual Platform/440BX Desktop Reference Platform, BIOS 6.00 07/28/2017
Sep 13 20:48:09 plex kernel: [ 7835.068753] Call Trace:
Sep 13 20:48:09 plex kernel: [ 7835.068759] dump_stack+0x63/0x85
Sep 13 20:48:09 plex kernel: [ 7835.068762] dump_header+0x57/0x315
Sep 13 20:48:09 plex kernel: [ 7835.068764] ? sched_clock+0x9/0x10
Sep 13 20:48:09 plex kernel: [ 7835.068765] ? sched_clock+0x9/0x10
Sep 13 20:48:09 plex kernel: [ 7835.068766] oom_kill_process+0x254/0x280
Sep 13 20:48:09 plex kernel: [ 7835.068767] out_of_memory+0x2b1/0x4f0
Sep 13 20:48:09 plex kernel: [ 7835.068769] __alloc_pages_slowpath+0xb32/0xe80
Sep 13 20:48:09 plex kernel: [ 7835.068771] __alloc_pages_nodemask+0x2a7/0x2c0
Sep 13 20:48:09 plex kernel: [ 7835.068773] alloc_pages_current+0x6a/0xe0
Sep 13 20:48:09 plex kernel: [ 7835.068775] __page_cache_alloc+0x6a/0xa0
Sep 13 20:48:09 plex kernel: [ 7835.068776] filemap_fault+0x3af/0x850
Sep 13 20:48:09 plex kernel: [ 7835.068778] ? page_add_file_rmap+0x18f/0x220
Sep 13 20:48:09 plex kernel: [ 7835.068779] ? __switch_to_asm+0x41/0x70
Sep 13 20:48:09 plex kernel: [ 7835.068781] ? xas_load+0xc/0x80
Sep 13 20:48:09 plex kernel: [ 7835.068782] ? xas_find+0x15b/0x1a0
Sep 13 20:48:09 plex kernel: [ 7835.068783] ? filemap_map_pages+0x7a/0x380
Sep 13 20:48:09 plex kernel: [ 7835.068786] ext4_filemap_fault+0x31/0x44
Sep 13 20:48:09 plex kernel: [ 7835.068787] __do_fault+0x57/0x11d
Sep 13 20:48:09 plex kernel: [ 7835.068789] __handle_mm_fault+0xe25/0x1300
Sep 13 20:48:09 plex kernel: [ 7835.068791] ? hrtimer_try_to_cancel+0x2a/0x110
Sep 13 20:48:09 plex kernel: [ 7835.068792] handle_mm_fault+0xe3/0x220
Sep 13 20:48:09 plex kernel: [ 7835.068794] __do_page_fault+0x292/0x4d0
Sep 13 20:48:09 plex kernel: [ 7835.068795] do_page_fault+0x2d/0xf0
Sep 13 20:48:09 plex kernel: [ 7835.068797] ? page_fault+0x8/0x30
Sep 13 20:48:09 plex kernel: [ 7835.068798] page_fault+0x1e/0x30
Sep 13 20:48:09 plex kernel: [ 7835.068799] RIP: 0033:0x7f85259c90d2
Sep 13 20:48:09 plex kernel: [ 7835.068803] Code: Bad RIP value.
Sep 13 20:48:09 plex kernel: [ 7835.068804] RSP: 002b:00007f84ca7fa780 EFLAGS: 00010202
Sep 13 20:48:09 plex kernel: [ 7835.068805] RAX: 0000000000000001 RBX: 0000000003dc05d8 RCX: 0000000000000000
Sep 13 20:48:09 plex kernel: [ 7835.068806] RDX: 0000000000000000 RSI: 0000000000000000 RDI: 0000000000000000
Sep 13 20:48:09 plex kernel: [ 7835.068806] RBP: 0000000003dc35c8 R08: 0000000000000001 R09: 0000000000000001
Sep 13 20:48:09 plex kernel: [ 7835.068806] R10: 0000000000000000 R11: 0000000000000000 R12: 0000000000000000
Sep 13 20:48:09 plex kernel: [ 7835.068807] R13: 0000000000000005 R14: 0000000003d4ced8 R15: 0000000000000001
Sep 13 20:48:09 plex kernel: [ 7835.068808] Mem-Info:
Sep 13 20:48:09 plex kernel: [ 7835.068811] active_anon:1256852 inactive_anon:183060 isolated_anon:0
Sep 13 20:48:09 plex kernel: [ 7835.068811] active_file:56 inactive_file:70 isolated_file:0
Sep 13 20:48:09 plex kernel: [ 7835.068811] unevictable:0 dirty:0 writeback:1 unstable:0
Sep 13 20:48:09 plex kernel: [ 7835.068811] slab_reclaimable:11744 slab_unreclaimable:19142
Sep 13 20:48:09 plex kernel: [ 7835.068811] mapped:39 shmem:2 pagetables:8103 bounce:0
Sep 13 20:48:09 plex kernel: [ 7835.068811] free:23681 free_pcp:17 free_cma:0
Sep 13 20:48:09 plex kernel: [ 7835.068813] Node 0 active_anon:5027408kB inactive_anon:732240kB active_file:224kB inactive_file:280kB unevictable:0kB isolated(anon):0kB isolated(file):0kB mapped:156kB dirty:0kB writeback:4kB shmem:8kB shmem_thp: 0kB shmem_pmdmapped: 0kB anon_thp: 43008kB writeback_tmp:0kB unstable:0kB all_unreclaimable? no
Sep 13 20:48:09 plex kernel: [ 7835.068813] Node 0 DMA free:15892kB min:176kB low:220kB high:264kB active_anon:0kB inactive_anon:0kB active_file:0kB inactive_file:0kB unevictable:0kB writepending:0kB present:15992kB managed:15908kB mlocked:0kB kernel_stack:0kB pagetables:0kB bounce:0kB free_pcp:0kB local_pcp:0kB free_cma:0kB
Sep 13 20:48:09 plex kernel: [ 7835.068816] lowmem_reserve[]: 0 2931 5874 5874 5874
Sep 13 20:48:09 plex kernel: [ 7835.068817] Node 0 DMA32 free:45316kB min:33640kB low:42048kB high:50456kB active_anon:2682448kB inactive_anon:309464kB active_file:156kB inactive_file:56kB unevictable:0kB writepending:4kB present:3129216kB managed:3063680kB mlocked:0kB kernel_stack:528kB pagetables:10248kB bounce:0kB free_pcp:68kB local_pcp:0kB free_cma:0kB
Sep 13 20:48:09 plex kernel: [ 7835.068819] lowmem_reserve[]: 0 0 2942 2942 2942
Sep 13 20:48:09 plex kernel: [ 7835.068821] Node 0 Normal free:33516kB min:33760kB low:42200kB high:50640kB active_anon:2344752kB inactive_anon:423028kB active_file:780kB inactive_file:0kB unevictable:0kB writepending:0kB present:3145728kB managed:3021388kB mlocked:0kB kernel_stack:7360kB pagetables:22164kB bounce:0kB free_pcp:0kB local_pcp:0kB free_cma:0kB
Sep 13 20:48:09 plex kernel: [ 7835.068823] lowmem_reserve[]: 0 0 0 0 0
Sep 13 20:48:09 plex kernel: [ 7835.068824] Node 0 DMA: 14kB (U) 08kB 116kB (U) 032kB 264kB (U) 1128kB (U) 1256kB (U) 0512kB 11024kB (U) 12048kB (M) 34096kB (M) = 15892kB
Sep 13 20:48:09 plex kernel: [ 7835.068828] Node 0 DMA32: 781
4kB (UME) 3238kB (UME) 25316kB (UME) 22032kB (UME) 8064kB (UME) 58128kB (UME) 35256kB (UME) 10512kB (UME) 21024kB (ME) 02048kB 04096kB = 45468kB
Sep 13 20:48:09 plex kernel: [ 7835.068832] Node 0 Normal: 6084kB (UME) 6668kB (UME) 47716kB (UME) 26032kB (ME) 10964kB (UME) 4128kB (UE) 4256kB (UM) 3512kB (UM) 11024kB (U) 02048kB 0*4096kB = 34784kB
Sep 13 20:48:09 plex kernel: [ 7835.068837] Node 0 hugepages_total=0 hugepages_free=0 hugepages_surp=0 hugepages_size=1048576kB
Sep 13 20:48:09 plex kernel: [ 7835.068838] Node 0 hugepages_total=0 hugepages_free=0 hugepages_surp=0 hugepages_size=2048kB
Sep 13 20:48:09 plex kernel: [ 7835.068838] 28638 total pagecache pages
Sep 13 20:48:09 plex kernel: [ 7835.068839] 28442 pages in swap cache
Sep 13 20:48:09 plex kernel: [ 7835.068840] Swap cache stats: add 6955154, delete 6926272, find 1920737/3119529
Sep 13 20:48:09 plex kernel: [ 7835.068840] Free swap = 0kB
Sep 13 20:48:09 plex kernel: [ 7835.068840] Total swap = 4194300kB
Sep 13 20:48:09 plex kernel: [ 7835.068840] 1572734 pages RAM
Sep 13 20:48:09 plex kernel: [ 7835.068841] 0 pages HighMem/MovableOnly
Sep 13 20:48:09 plex kernel: [ 7835.068841] 47490 pages reserved
Sep 13 20:48:09 plex kernel: [ 7835.068841] 0 pages cma reserved
Sep 13 20:48:09 plex kernel: [ 7835.068842] 0 pages hwpoisoned
Sep 13 20:48:09 plex kernel: [ 7835.068842] Tasks state (memory values in pages):
Sep 13 20:48:09 plex kernel: [ 7835.068842] [ pid ] uid tgid total_vm rss pgtables_bytes swapents oom_score_adj name
Sep 13 20:48:09 plex kernel: [ 7835.068849] [ 625] 0 625 25749 2 212992 177 0 systemd-journal
Sep 13 20:48:09 plex kernel: [ 7835.068850] [ 652] 0 652 24426 0 94208 53 0 lvmetad
Sep 13 20:48:09 plex kernel: [ 7835.068852] [ 658] 0 658 11581 2 118784 490 -1000 systemd-udevd
Sep 13 20:48:09 plex kernel: [ 7835.068853] [ 781] 62583 781 35481 0 176128 156 0 systemd-timesyn
Sep 13 20:48:09 plex kernel: [ 7835.068854] [ 782] 0 782 22055 0 155648 365 0 VGAuthService
Sep 13 20:48:09 plex kernel: [ 7835.068855] [ 783] 0 783 29525 108 233472 246 0 vmtoolsd
Sep 13 20:48:09 plex kernel: [ 7835.068856] [ 786] 0 786 11899 0 139264 137 0 rpcbind
Sep 13 20:48:09 plex kernel: [ 7835.068858] [ 941] 100 941 20010 0 180224 191 0 systemd-network
Sep 13 20:48:09 plex kernel: [ 7835.068859] [ 960] 101 960 17689 45 176128 133 0 systemd-resolve
Sep 13 20:48:09 plex kernel: [ 7835.068860] [ 1073] 0 1073 7082 0 102400 55 0 atd
Sep 13 20:48:09 plex kernel: [ 7835.068861] [ 1082] 102 1082 65758 0 163840 483 0 rsyslogd
Sep 13 20:48:09 plex kernel: [ 7835.068862] [ 1083] 0 1083 71583 15 196608 218 0 accounts-daemon
Sep 13 20:48:09 plex kernel: [ 7835.068863] [ 1092] 0 1092 27639 26 110592 74 0 irqbalance
Sep 13 20:48:09 plex kernel: [ 7835.068864] [ 1095] 0 1095 17647 0 176128 190 0 systemd-logind
Sep 13 20:48:09 plex kernel: [ 7835.068865] [ 1100] 0 1100 7506 0 98304 78 0 cron
Sep 13 20:48:09 plex kernel: [ 7835.068866] [ 1102] 0 1102 42274 1 221184 1945 0 networkd-dispat
Sep 13 20:48:09 plex kernel: [ 7835.068867] [ 1103] 0 1103 66011 33 528384 471 0 nmbd
Sep 13 20:48:09 plex kernel: [ 7835.068868] [ 1104] 103 1104 12536 1 139264 184 -900 dbus-daemon
Sep 13 20:48:09 plex kernel: [ 7835.068870] [ 1128] 0 1128 46485 0 266240 2000 0 unattended-upgr
Sep 13 20:48:09 plex kernel: [ 7835.068871] [ 1129] 1000 1129 2393813 1403879 18944000 893235 0 rclone
Sep 13 20:48:09 plex kernel: [ 7835.068872] [ 1138] 0 1138 23884 0 77824 79 0 lxcfs
Sep 13 20:48:09 plex kernel: [ 7835.068873] [ 1144] 0 1144 343696 0 311296 3247 -900 snapd
Sep 13 20:48:09 plex kernel: [ 7835.068874] [ 1154] 0 1154 18073 0 188416 188 -1000 sshd
Sep 13 20:48:09 plex kernel: [ 7835.068875] [ 1155] 112 1155 1156 0 57344 22 0 sh
Sep 13 20:48:09 plex kernel: [ 7835.068876] [ 1163] 0 1163 72219 0 212992 261 0 polkitd
Sep 13 20:48:09 plex kernel: [ 7835.068877] [ 1172] 0 1172 3721 0 65536 38 0 agetty
Sep 13 20:48:09 plex kernel: [ 7835.068878] [ 1197] 112 1197 944938 2907 1175552 46072 0 Plex Media Serv
Sep 13 20:48:09 plex kernel: [ 7835.068880] [ 1312] 0 1312 88841 0 720896 684 0 smbd
Sep 13 20:48:09 plex kernel: [ 7835.068881] [ 1345] 0 1345 85910 0 675840 666 0 smbd-notifyd
Sep 13 20:48:09 plex kernel: [ 7835.068882] [ 1346] 0 1346 85908 0 667648 656 0 cleanupd
Sep 13 20:48:09 plex kernel: [ 7835.068883] [ 1483] 113 1483 587947 548 684032 21871 0 python
Sep 13 20:48:09 plex kernel: [ 7835.068884] [ 1518] 112 1518 464603 70 540672 10415 0 Plex Script Hos
Sep 13 20:48:09 plex kernel: [ 7835.068885] [ 1554] 0 1554 26420 1 253952 248 0 sshd
Sep 13 20:48:09 plex kernel: [ 7835.068886] [ 1647] 112 1647 128660 0 274432 493 0 Plex Tuner Serv
Sep 13 20:48:09 plex kernel: [ 7835.068887] [ 1649] 112 1649 309065 187 405504 1124 0 Plex DLNA Serve
Sep 13 20:48:09 plex kernel: [ 7835.068888] [ 1698] 112 1698 240052 69 425984 9416 0 Plex Script Hos
Sep 13 20:48:09 plex kernel: [ 7835.068889] [ 1700] 112 1700 361202 590 589824 18621 0 Plex Script Hos
Sep 13 20:48:09 plex kernel: [ 7835.068890] [ 1779] 1000 1779 19160 0 184320 274 0 systemd
Sep 13 20:48:09 plex kernel: [ 7835.068892] [ 1791] 1000 1791 27962 0 249856 621 0 (sd-pam)
Sep 13 20:48:09 plex kernel: [ 7835.068893] [ 1916] 1000 1916 26995 0 253952 264 0 sshd
Sep 13 20:48:09 plex kernel: [ 7835.068894] [ 1917] 1000 1917 5372 1 90112 437 0 bash
Sep 13 20:48:09 plex kernel: [ 7835.068895] [ 2088] 1000 2088 1552 0 57344 34 0 tail
Sep 13 20:48:09 plex kernel: [ 7835.068896] [ 2221] 0 2221 26420 1 249856 247 0 sshd
Sep 13 20:48:09 plex kernel: [ 7835.068897] [ 2305] 1000 2305 26995 0 253952 259 0 sshd
Sep 13 20:48:09 plex kernel: [ 7835.068898] [ 2306] 1000 2306 5372 1 86016 422 0 bash
Sep 13 20:48:09 plex kernel: [ 7835.068899] [ 2930] 0 2930 89950 41 720896 674 0 smbd
Sep 13 20:48:09 plex kernel: [ 7835.068900] [ 3253] 1000 3253 1552 0 53248 49 0 tail
Sep 13 20:48:09 plex kernel: [ 7835.068901] [ 3492] 0 3492 26420 1 249856 249 0 sshd
Sep 13 20:48:09 plex kernel: [ 7835.068902] [ 3575] 1000 3575 27150 0 253952 384 0 sshd
Sep 13 20:48:09 plex kernel: [ 7835.068903] [ 3576] 1000 3576 5438 1 86016 497 0 bash
Sep 13 20:48:09 plex kernel: [ 7835.068904] [ 4375] 112 4375 4454 16 81920 170 0 EasyAudioEncode
Sep 13 20:48:09 plex kernel: [ 7835.068905] [ 5073] 112 5073 70514 1182 385024 14801 0 Plex Transcoder
Sep 13 20:48:09 plex kernel: [ 7835.068906] [ 7190] 112 7190 93044 0 499712 5072 0 Plex Media Scan
Sep 13 20:48:09 plex kernel: [ 7835.068907] [ 7208] 112 7208 238972 66 417792 8317 0 Plex Script Hos
Sep 13 20:48:09 plex kernel: [ 7835.068909] [ 8329] 112 8329 66646 164 425984 3656 0 Plex Media Scan
Sep 13 20:48:09 plex kernel: [ 7835.068909] oom-kill:constraint=CONSTRAINT_NONE,nodemask=(null),cpuset=/,mems_allowed=0,global_oom,task_memcg=/system.slice/gmedia-rclone.service,task=rclone,pid=1129,uid=1000
Sep 13 20:48:09 plex kernel: [ 7835.068914] Out of memory: Kill process 1129 (rclone) score 894 or sacrifice child
Sep 13 20:48:09 plex kernel: [ 7835.068976] Killed process 1129 (rclone) total-vm:9575252kB, anon-rss:5615516kB, file-rss:0kB, shmem-rss:0kB
Sep 13 20:48:09 plex kernel: [ 7835.410154] oom_reaper: reaped process 1129 (rclone), now anon-rss:0kB, file-rss:0kB, shmem-rss:0kB
Sep 13 20:47:32 plex sh[1155]: message repeated 355 times: [ Sqlite3: Sleeping for 200ms to retry busy DB.]
Sep 13 20:48:09 plex systemd[1]: gmedia-rclone.service: Main process exited, code=killed, status=9/KILL
Sep 13 20:48:09 plex systemd[1]: gmedia-rclone.service: Failed with result 'signal'.
Sep 13 20:48:09 plex systemd[1]: gmedia-rclone.service: Service hold-off time over, scheduling restart.
Sep 13 20:48:10 plex systemd[1]: gmedia-rclone.service: Scheduled restart job, restart counter is at 1.
Sep 13 20:48:10 plex systemd[1]: Stopped RClone Service.
Sep 13 20:48:10 plex systemd[1]: Starting RClone Service...
Sep 13 20:48:11 plex systemd[1]: gmedia-rclone.service: Main process exited, code=exited, status=1/FAILURE
Sep 13 20:48:11 plex systemd[1]: gmedia-rclone.service: Failed with result 'exit-code'.
Sep 13 20:48:11 plex systemd[1]: Failed to start RClone Service.

It isn't perfect, but it should help lead somewhere (I hope). I will have to obtain the debugging later (when I am not at work). Should be another few hours.

Would you prefer a bug report on Github, or continue talking here?

I'd guess the stack trace was a crash due to out of memory. We'd need to get the info before it crashed out though to see what's going on as that definitely is not normal.

That is the out of memory killer rearing it's ugly head. It decided to kill rclone here

So looks like it made the right choice (not a given!).

Let's try to narrow it down here then we can make a github issue.

@Animosity022 / @ncw

This is what I could gather at the time, I haven't seen it rise to 98% CPU usage just yet again. But, I ams ure if I wait long enough, it will get there.

Text Log: https://drive.google.com/open?id=1-gHJkUXR-xJU4QYWl2RD8lwOlG107Kxv
Graphs: https://drive.google.com/open?id=1kYeeitau_fZnyMapu7cYmeRJaqSqFq1F

If you can't see the above svg graphics, it seems to accumulate to this: bytes|makeSlice 2202.1 MB 96.4%

Thanks for that - a good start! So it looks like there isn't a goroutine leak and that

3668.18MB 98.07% 98.07% 3668.18MB 98.07% bytes.makeSlice

Is the culprit.

We need to know what calls it though.

That should be in the graphics. I couldn't get any of them to load though - are the SVG files? Why do they have the .gz extension?

This is how you generate the svg

$ go tool pprof -svg http://localhost:5572/debug/pprof/heap
Fetching profile over HTTP from http://localhost:5572/debug/pprof/heap
Saved profile in /home/ncw/pprof/pprof.rclone.alloc_objects.alloc_space.inuse_objects.inuse_space.069.pb.gz
Generating report in profile001.svg

Note it is the profile001.svg file that it is the image.

Figured out that you can use the .gz files directly like this

go tool pprof -svg pprof.rclone.alloc_objects.alloc_space.inuse_objects.inuse_space.013.pb.gz

The end of it looks like this

So it looks like it is the cache backend asking for persistent chunks.

Can you post your cache settings?

I suspect https://rclone.org/cache/#cache-chunk-no-memory might fix the problem but at what performance cost I don't know?

[gcache]
type = cache
remote = gdrive:media
plex_url = VALIDURL
plex_username = user
plex_password = *** ENCRYPTED ***
chunk_size = 1G
chunk_total_size = 32G
info_age = 2d
plex_token = OMIT
--------------------

I did notice that setting about the cache-chunk-no-memory, but yeah, the performance cost has me a bit worried. If there is a way to cap it, that would be better. I thought the chunk total size would be targeted at the disk, so if I am wrong, then maybe that is the issue there.

Your chunk_size is very big... I think the chunks are probably being brought into memory which is the cause of the problem when you have a few files open when scanning. Each file open will need 1 chunk in memory which at 1 GB adds up quickly...

Also you have chunk_total_size = 32G but it doesn't look like you have enough memory for that?

The cache chunk size + a plex scan would open enough files to easily crash the system and that would cause the issue.

So I guess here is the confusion:

The total size that the chunks can take up on the local disk.

If the cache exceeds this value then it will start to delete the oldest chunks until it goes under this value.

This says disk, nor RAMdisk/RAM so I took it literally to mean drive/disk. The cache file located on the physical (or virtual) drive.

Same with:

--cache-chunk-size

The size of a chunk (partial file data).

Use lower numbers for slower connections. If the chunk size is changed, any downloaded chunks will be invalid and cache-chunk-path will need to be cleared or unexpected EOF errors will occur.

I was under the impression that this was a part of the drive on disk.

If all of this is stored in RAM, then I need to re-alter these values for a 1000/50 Mb connection.

What would optimal values for this be then if the RAM capacity is normally at 6GB for a Plex server?

You want to configure somewhere in the realm of you expected open files * chunk = expected total size.

If you are scanning on Plex, it can open quite the number of files.

Most people use 32M / 64M as too small means too many API calls and it is ineffective. Too big and (as you see), you run out of memory.

Can you confirm the affect of chunk_total_size?

The documentation currently says:

The total size that the chunks can take up on the local disk.

But you seem to be implying, and some anecdotal testing seems to confirm, that if chunk_no_memory isn’t set, then this limit applies to both memory and disk? If that’s the case, then the default of 10G seems rather high, no?

Can we get clarification, and then see if there’s a documentation update to be done, and possibly a tweak to the default for chunk_total_size?

This topic was automatically closed 90 days after the last reply. New replies are no longer allowed.