Hi,
spend the past hours to implement rclone mount with --rc to import some /metrics to prometheus and make a grafana rclone dashboard for monitoring.
The rclone docs for remote controlling rclone are very good, thanks to @ncw. So lets start with prometheus configuration. To import the metrics from our rclone mount into prometheus we need a scrape_config in the prometheus.yaml config file.
# my global config
global:
  scrape_interval:     15s # Set the scrape interval to every 15 seconds. Default is every 1 minute.
  evaluation_interval: 15s # Evaluate rules every 15 seconds. The default is every 1 minute.
  # scrape_timeout is set to the global default (10s).

# Alertmanager configuration
alerting:
  alertmanagers:
  - static_configs:
    - targets:
      # - alertmanager:9093

# Load rules once and periodically evaluate them according to the global 'evaluation_interval'.
rule_files:
  # - "first_rules.yml"
  # - "second_rules.yml"

  # A scrape configuration containing exactly one endpoint to scrape:
  # Here it's Prometheus itself.
  scrape_configs:

  # Make Prometheus scrape itself for metrics.
  - job_name: 'prometheus'
    static_configs:
    - targets: ['localhost:9090']

  # scrape rclone rc
  - job_name: 'rclone_scrape'
    static_configs:
    - targets: ['localhost:5572'] # Server IP with "rclone mount --rc"
    basic_auth:
      username: 'rclone'
      password: '<your-secret-pass>'
the username + password authentication in the basic_auth part of the job rclone_scrape must be the same you specified with --rc-user and --rc-pass in rclone mount --rc
Now we can check the correct config in the prometheus webui
- prometheus.host:9090/targets to check rclone_scrape
- prometheus.host:9090/graph to check the rclone metrics (rclone_bytes_transferred_total)
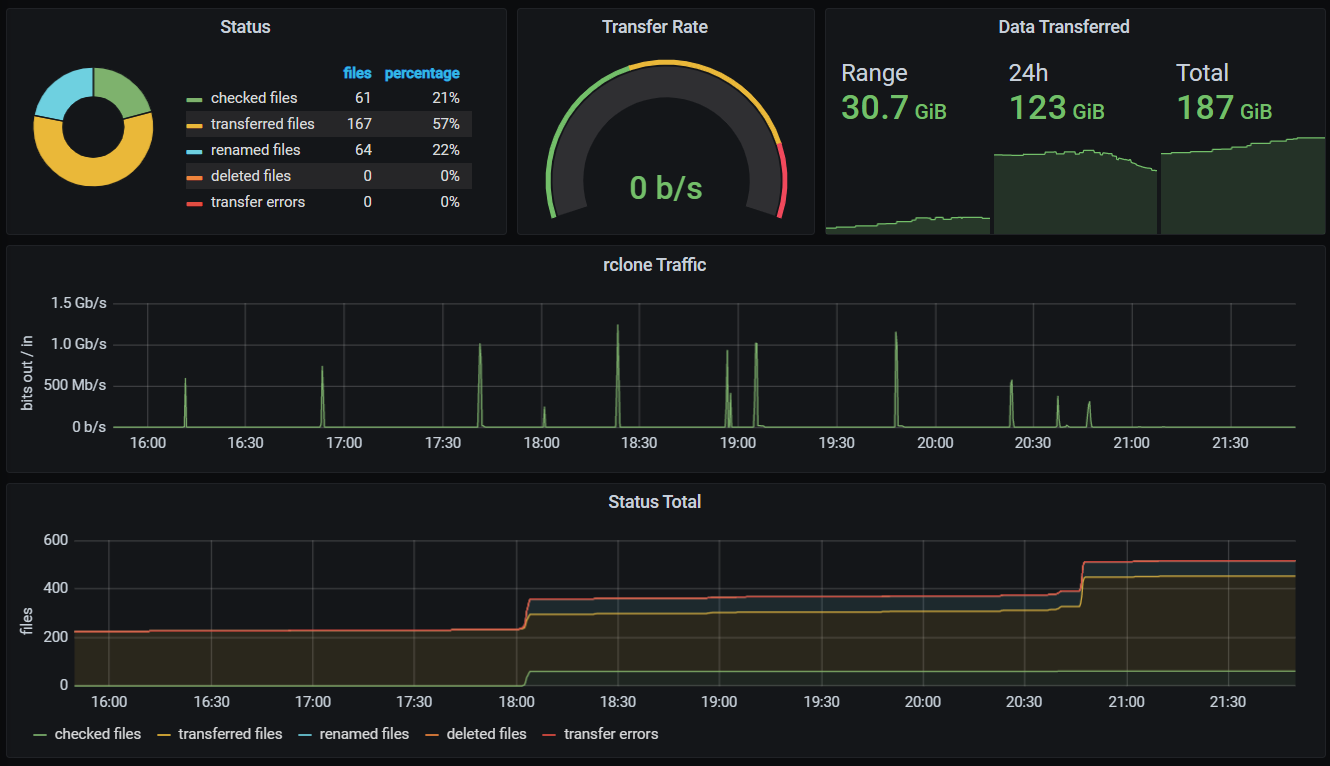
Finally we can create our grafana dashboard individually. Here is my dashboard that I want to share with you. I am looking forward to your feedback! 
Rclone-1602705184340.json.txt (13.5 KB) please rename to .json to import into grafana