I am having problems with a specific client in my setup that is causing an insanely high memory usage of rclone.
On my server runs Emby and the client causing that issue is using the offical Emby for SamsungTV app.
Whenever I start a stream on that client the memory usage of rclone goes steady up until it hits the limit.
After some discussion over here this is the mount command I am using:
The Debug-Log can be found over here -> Microsoft OneDrive
And the memlog file over here -> Microsoft OneDrive
In the memlog you can see that rclone was using more than 1GB at that point for just one stream there was nothing else going on there.
@ncw, you were asking for a memprofile on github I think was able to create on at a point were rclone was consuming >1gb of memory. -> Microsoft OneDrive
On github you told me that on the log I provided over there were 22 open files. Can you tell me how many files are open on that log? From my noobish point of view there should be only 1 open file (because just one client was streaming one specific file) but apparently (in this log) there are a lot of open files again, right?
Given that this only happens with a that specific client I am honestly not sure if this is a rclone or an Emby problem I am still trying to narrow it down.
In case you need clarification or additional information, just let me know.
Thanks!
I too have noticed high memory usage. When I first start up rclone mount, there are about 8 pids. After a few weeks, it is up to around 35. Memory usage increases over time too.
I am currently using rclone v1.39-102-g8df78f2bβ.
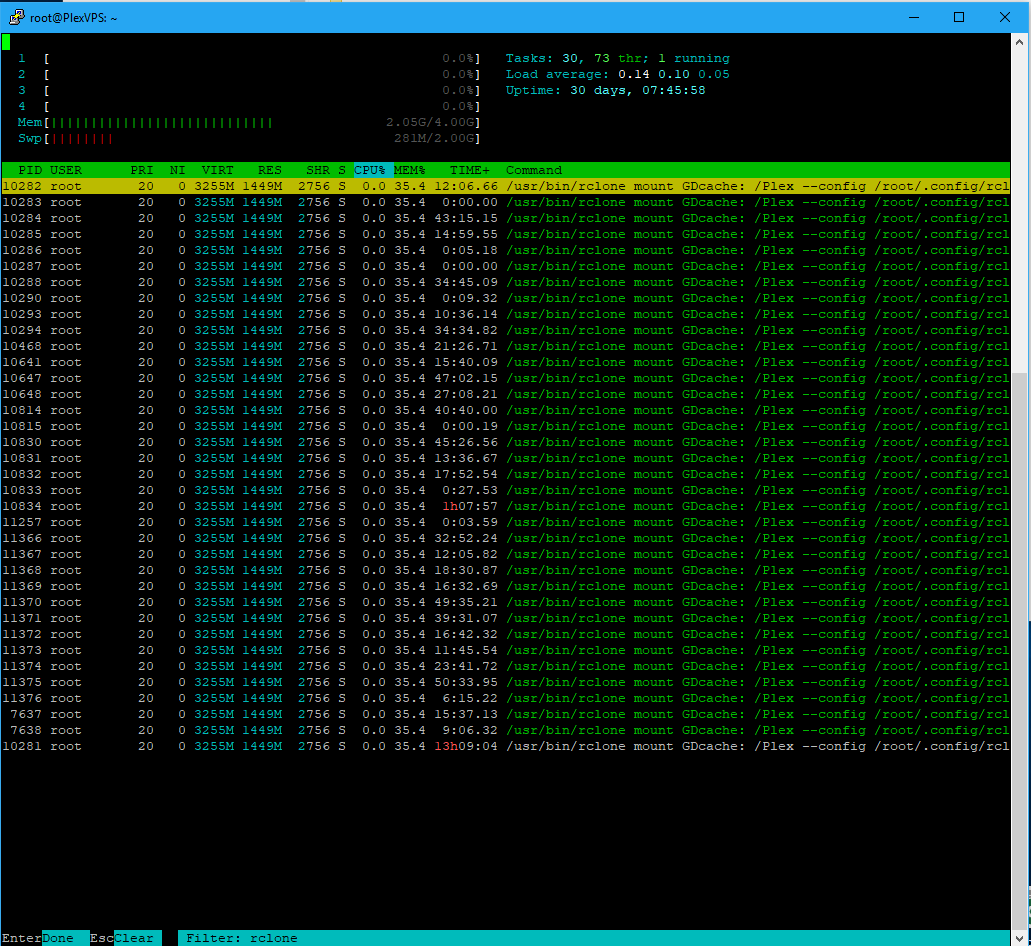
This is a view in htop of just the rclone command before restarting rclone mount service.
There is no plex activity right now when I took this screen shot.
Last night, there was one stream going and the memory usage was at 70%.
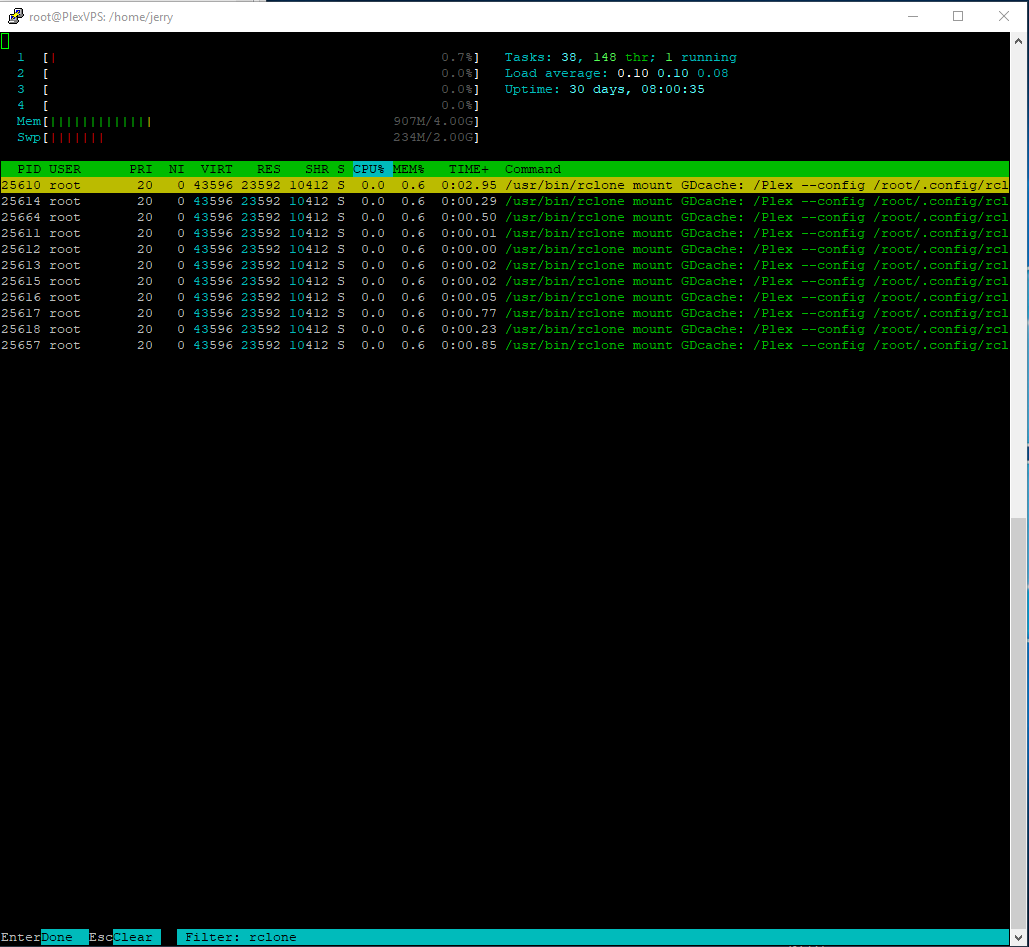
The second screen shot is right after restarting the mount service.
Is anyone else seeing this many pids? is it normal to leave so many around?
Those are not separate processes, but by default htop shows threads for each process, which is totally normal.
The more files and such you open up and use, you are going to see more threads used.
It all depends on how many files you have open on the mount.
Easy way to check is by running ‘lsof /mountpoint’ and you can see what’s being used.
Looks like:
[root@gemini system]# lsof /GD
COMMAND   PID  USER   FD   TYPE DEVICE  SIZE/OFF                NODE NAME
rclone  26178 felix    5r   REG   0,48 983472829 5216664640513973489 /GD/media/smu5ej34ujbdoip1cm3mlk92q4/tpu8rejc4e9v27iihuhc7mc3ps/qjn58891qrjalgp5l5sggv6c864vajhkd3mf5t5kn46hof7i9urg
[root@gemini system]# lsof /media
COMMAND    PID  USER   FD   TYPE DEVICE  SIZE/OFF                 NODE NAME
mergerfs 31294 felix   23r   REG   0,49 983232749 12728963985777509007 /media/TV/Blindspot/Blindspot.S01E01.HDTV-720p.mkv
[root@gemini system]#
Not sure why they made that the default in htop, but in F2-Setup-Display, there is an option to turn off the user threads, which is the normal ‘top’ type output.
Thank you. I’ll keep that in mind.
But there does appear to be a significant memory growth over time that is related to rclone. When I restart the rclone mount service, memory usage drops significantly.
I’m just curious if anyone else has observed a growth in memory usage.
My current mount command. I guess I could try the --cache-chunk-no-memory flag.
@Animosity022, thanks for the hint with lsof /mountpoint gonna try that one when memory usage is going high. @zSeriesGuy, the --cache-chunk-no-memory flag didn’t help in my case but on the other side I am not using rclone cache and I am not sure if it is a cache specific flag or not…
Did you quit rclone at that point? Unfortunately it doesn't write the memory profile until you quit it and the one you posted was very small (only 10 bytes).
I'd love to see a profile if you can have another go - thanks.
Hi
I’ve noticed the same problem with memory management. I checked that the memory problem affects version 1.39 and 1.40 while version 1.38 is working correctly.
IIRC then I must have quit rclone right before it crashed but apparently, it might have been a tiny bit to late and that caused the mem profile being so small (I was also wondering about that).
The problem I had was not caused by rclone but by an Emby client. It apparently continued to open files until my server ran out of memory and then the things crashed. The client opened the file as much as >30 times.
Well, the fun thing was I was only streaming one file with that problematic client and I still do not know how but over time that one client opened the file up like over 30 times and led to the memory issues.