Is playback pretty much unusable for you when Plex scans are happening? This has been happening since the beginning, so I just wanted to make sure its not just me.
So with Plex, there are a few things to think about.
When media is first added, it needs to be analyzed, which runs a ffprobe/mediainfo type thing against it. Once that is done, it just checks file size/mod times on it (super fast).
My 60TB library scan pretty much takes less than 20 seconds.
I usually stream at most 5-7 streams at times and no real issues as I have a gigabit FIOS link.
My actual speeds are 1000/40 from Comcast (fastest in my area unfortunately). Right now, I’m only getting ~500mbps maximum, but haven’t had time to diagnose the issue with that yet.
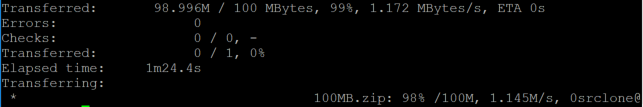
Here’s the 100mb test file using Ubuntu server. No docker involved.
I have done some more testing, originally thinking it had something to do with my Sophos gateway between my devices and router. I bypassed it and had the same results so that ruled it out. A simple wget got me about 150-200 mbps download with or without it.
When rclone is restarted, the directory cache is lost so when Plex does a scan then, does it make things unusable? I believe I saw in your scripts something about warming up the cache, so if you try to playback media during that period, is it possible?
No, nothing is ‘unusable’. If you want to scan the whole directory structure, that depends on how many directory/files you have.
A full refresh from cold takes about 25-30 seconds for me.
I have like 30k ish files.
If you hit play and it was cold, it would take a few API hits to grab the directory structure so maybe 10 seconds.
[felix@gemini ~]$ time ls -al /GD/TV/Preacher/Preacher.S01E01.mkv
-rw-rw-r-- 1 felix felix 2661673016 May 22  2016 /GD/TV/Preacher/Preacher.S01E01.mkv

real	0m0.003s
user	0m0.002s
sys	0m0.000s
[felix@gemini ~]$ time ls -al /Test/TV/Preacher/Preacher.S01E01.mkv
-rw-r--r-- 1 felix felix 2661673016 May 22  2016 /Test/TV/Preacher/Preacher.S01E01.mkv

real	0m10.969s
user	0m0.004s
sys	0m0.000s
An example above.
I use the rc commands to build the cache on boot as that’s a bit faster than manually walking the tree.
 time /usr/bin/rclone rc vfs/refresh recursive=true
{
	"result": {
		"": "OK"
	}
}

real	0m26.480s
user	0m0.007s
sys	0m0.015s
At no point would anything ever be ‘unusable’. It may take a few seconds if cold and that’s it.
When I run vfs/refresh, it takes over 1 minute, and I have significantly fewer files than you.
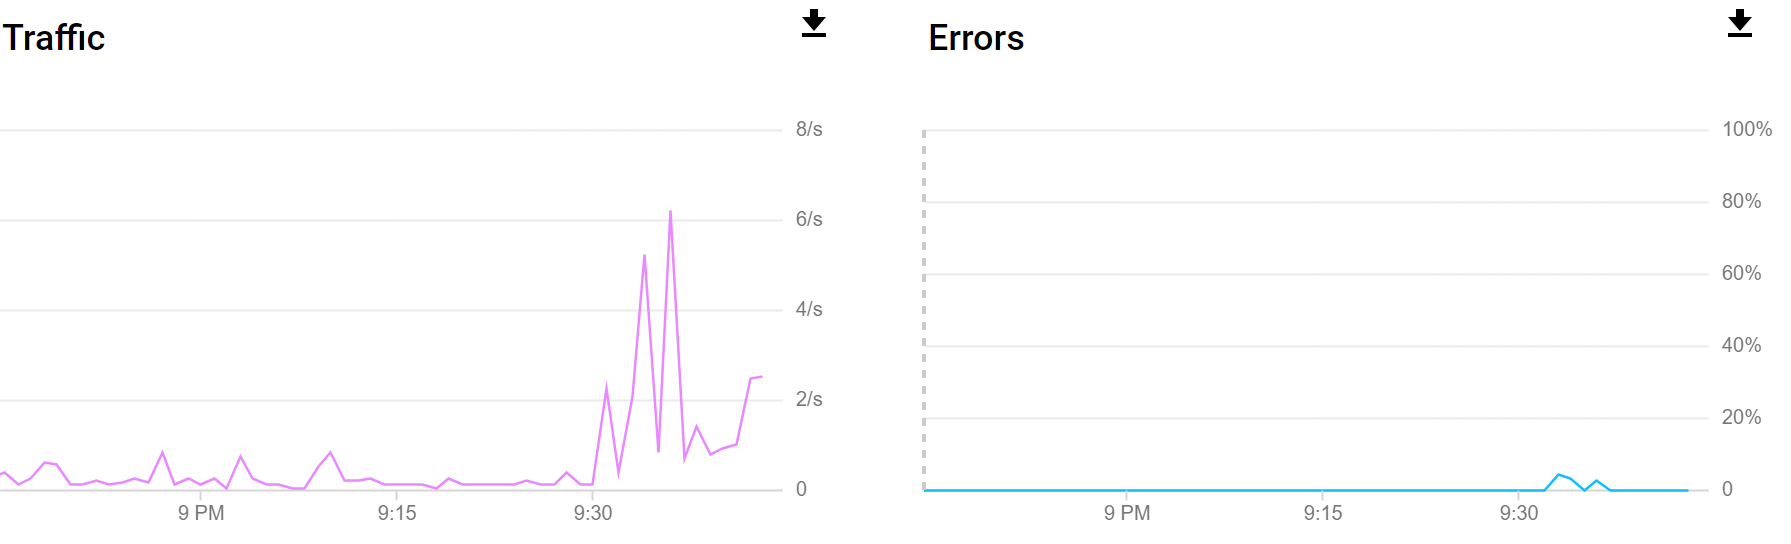
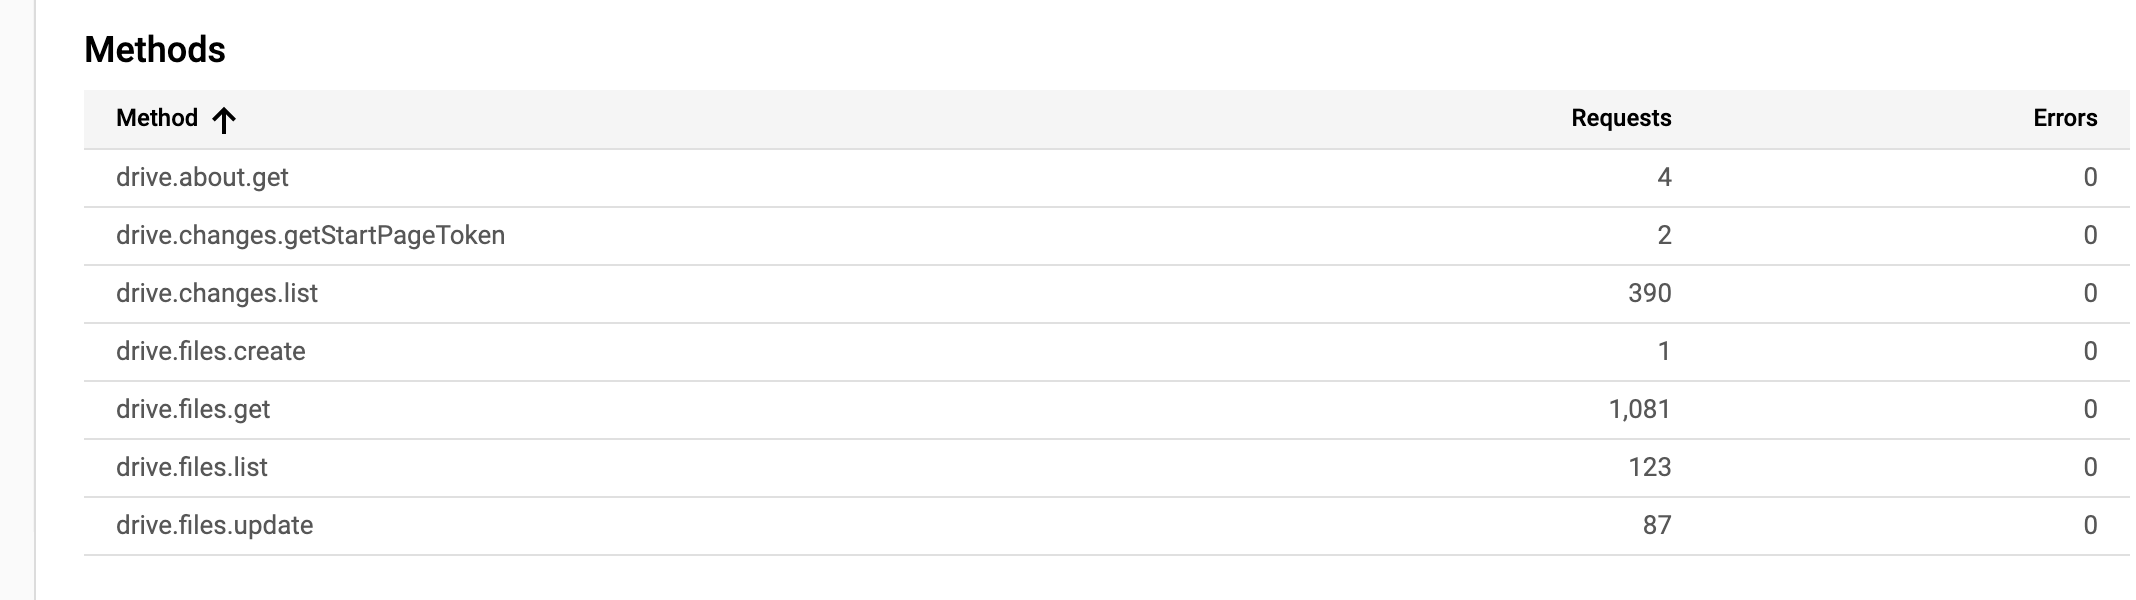
I also get these errors when running it which is why I think I added the tpslimit in the first place
2019/04/13 20:35:23 DEBUG : pacer: Rate limited, sleeping for 1.364894562s (1 consecutive low level retries)

4/13/2019 9:35:23 PM 2019/04/13 20:35:23 DEBUG : pacer: low level retry 1/10 (error googleapi: Error 403: User Rate Limit Exceeded. Rate of requests for user exceed configured project quota. You may consider re-evaluating expected per-user traffic to the API and adjust project quota limits accordingly. You may monitor aggregate quota usage and adjust limits in the API Console: https://console.developers.google.com/apis/api/drive.googleapis.com/quotas?project=919561382685, userRateLimitExceeded)

4/13/2019 9:35:23 PM 2019/04/13 20:35:23 DEBUG : pacer: Rate limited, sleeping for 2.231453049s (2 consecutive low level retries)

4/13/2019 9:35:23 PM 2019/04/13 20:35:23 DEBUG : pacer: low level retry 3/10 (error googleapi: Error 403: User Rate Limit Exceeded. Rate of requests for user exceed configured project quota. You may consider re-evaluating expected per-user traffic to the API and adjust project quota limits accordingly. You may monitor aggregate quota usage and adjust limits in the API Console: https://console.developers.google.com/apis/api/drive.googleapis.com/quotas?project=919561382685, userRateLimitExceeded)

4/13/2019 9:35:23 PM 2019/04/13 20:35:23 DEBUG : pacer: Rate limited, sleeping for 4.741085994s (3 consecutive low level retries)

4/13/2019 9:35:23 PM 2019/04/13 20:35:23 DEBUG : pacer: low level retry 1/10 (error googleapi: Error 403: User Rate Limit Exceeded. Rate of requests for user exceed configured project quota. You may consider re-evaluating expected per-user traffic to the API and adjust project quota limits accordingly. You may monitor aggregate quota usage and adjust limits in the API Console: https://console.developers.google.com/apis/api/drive.googleapis.com/quotas?project=919561382685, userRateLimitExceeded)

4/13/2019 9:35:23 PM 2019/04/13 20:35:23 DEBUG : pacer: Rate limited, sleeping for 8.866874665s (4 consecutive low level retries)

4/13/2019 9:35:23 PM 2019/04/13 20:35:23 DEBUG : pacer: low level retry 1/10 (error googleapi: Error 403: User Rate Limit Exceeded. Rate of requests for user exceed configured project quota. You may consider re-evaluating expected per-user traffic to the API and adjust project quota limits accordingly. You may monitor aggregate quota usage and adjust limits in the API Console: https://console.developers.google.com/apis/api/drive.googleapis.com/quotas?project=919561382685, userRateLimitExceeded)

4/13/2019 9:35:23 PM 2019/04/13 20:35:23 DEBUG : pacer: Rate limited, sleeping for 16.821812793s (5 consecutive low level retries)

4/13/2019 9:35:23 PM 2019/04/13 20:35:23 DEBUG : pacer: low level retry 1/10 (error googleapi: Error 403: User Rate Limit Exceeded. Rate of requests for user exceed configured project quota. You may consider re-evaluating expected per-user traffic to the API and adjust project quota limits accordingly. You may monitor aggregate quota usage and adjust limits in the API Console: https://console.developers.google.com/apis/api/drive.googleapis.com/quotas?project=919561382685, userRateLimitExceeded)

4/13/2019 9:35:24 PM 2019/04/13 20:35:24 DEBUG : pacer: Resetting sleep to minimum 100ms on success
Yeah, I don’t even have rclone under the manage apps section in drive. The link in the error message also links back to my key. I can also see the errors in the api console.
Also Plex scans take several minutes with the warm cache, so I’m not sure how your’s are so fast. I would like to learn. (Just ran it again and it took 5 full minutes with a warm cache)
Yeah, you have a really odd setup going on with your rancheros/dockers/merger/etc. I wouldn’t even fathom where to start looking as I don’t use any dockers or anything else as it just over complicates stuff for me.
If your refresh is 403’ing out, you definitely got something else going on but not sure what else I’d check.
So with regards to the vfs/refresh causing 403 errors, it was because I had taken out the tpslimit 5. With the tpslimit, there are no errors at all. Still not sure why you don’t have any errors without tpslimit.
Though it still takes over 1 minute, compared the the 30 seconds for you.
2019/04/13 23:37:54 DEBUG : : Reading directory tree done in 1m37.224054462s
Well I think I just found the problem with the refresh taking so long. You asked just the right question!
Good news:
I had a folder with many many small documents that were inside the refresh scope. I adjusted the command with the “rc dir” option which limited the scope to just the media files. That significantly increased the scan speed from over 1 minute to just 10 seconds.
Bad news:
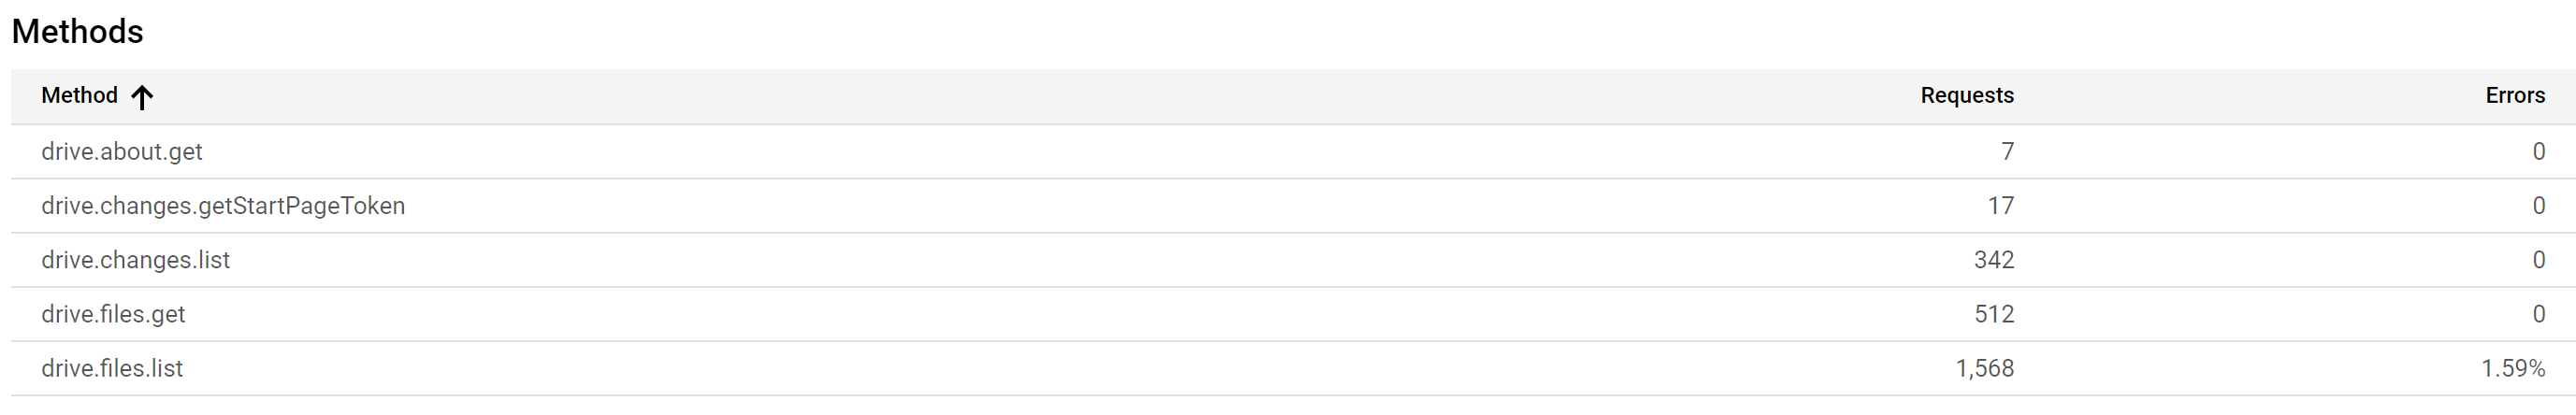
Without tpslimit, I still get rate limiting issues. I was, however, able to get tpslimit significantly higher at 1750 being the maximum without facing any issues. Any higher, the rate issues begin popping up again.
Plex scans still take over 3 minutes to complete. There are 414 directories and 5443 files. Running the find command for directories and files each take less than 1 second. No idea why plex scans still take so long…
Would be in the plex logs most likely as usually that relates back to media.
I use:
To see what is left to analyze in my library.
Should look something like this if it’s all analyzed.
[felix@gemini ~]$ plex-library-stats.sh  | tail -10
Minutes = 11278
  Hours = 187
   Days = 7

25823 files in library
0 files missing analyzation info
0 media_parts marked as deleted
0 metadata_items marked as deleted
0 directories marked as deleted
25209 files missing deep analyzation info.
Deep analysis is only used for bandwidth restrictions/limiting and I don’t use that and it’s off. It is super intensive as it needs to analyze the entire movie as it is looking for bitrates.