File staying in memory

What is the problem you are having with rclone?

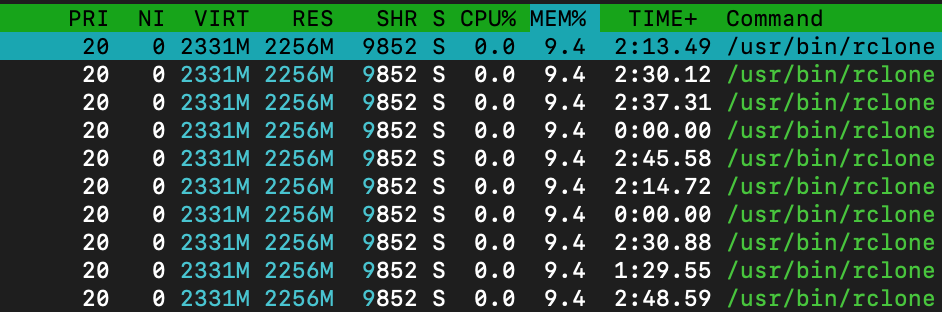
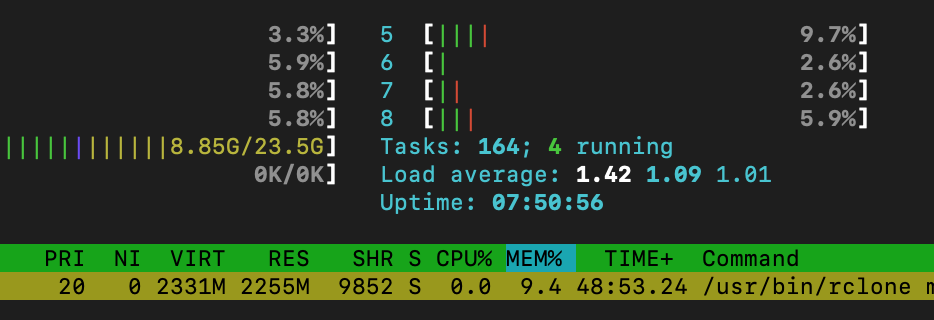
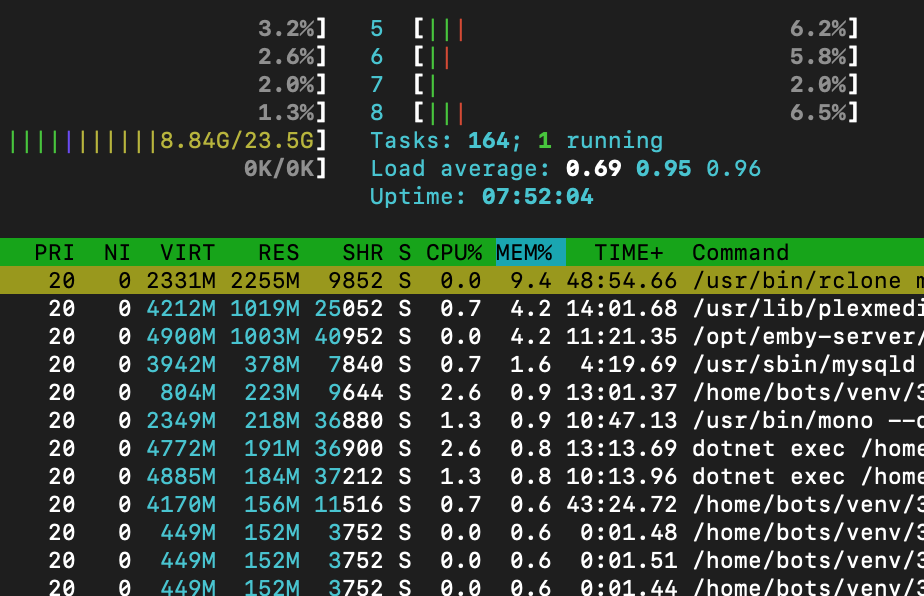
It seems files i play in plex are staying in memory. I restart my server, play a file and about 1g ram is consumed. i stop that file and the ram usage stays. i open another and another 1g is consumed etc. etc.

What is your rclone version (output from rclone version)

rclone v1.49.1

  • os/arch: linux/amd64

  • go version: go1.12.9

Which OS you are using and how many bits (eg Windows 7, 64 bit)

Ubuntu 18

Which cloud storage system are you using? (eg Google Drive)

Google Drive

The command you were trying to run (eg rclone copy /tmp remote:tmp)

rclone mount drive:media /mnt/media \
--allow-other \
--buffer-size 512M \
--dir-cache-time 8760h \
--vfs-read-chunk-size 16M \
--vfs-read-chunk-size-limit 2G \
--vfs-cache-poll-interval 1m \
--log-level NOTICE \
--log-file /opt/rclone/logs/rclone.log \
--timeout 1h \
--umask 002 \
--user-agent rclone \
--rc

You are configured to use 512M per file opened.

How are you checking memory?

Can you share this?

felix@gemini:~$ rclone rc core/memstats
{
	"Alloc": 64917864,
	"BuckHashSys": 2383184,
	"Frees": 1051329992,
	"GCSys": 24014848,
	"HeapAlloc": 64917864,
	"HeapIdle": 561577984,
	"HeapInuse": 108101632,
	"HeapObjects": 630954,
	"HeapReleased": 499449856,
	"HeapSys": 669679616,
	"MCacheInuse": 13888,
	"MCacheSys": 16384,
	"MSpanInuse": 2334240,
	"MSpanSys": 4128768,
	"Mallocs": 1051960946,
	"OtherSys": 1854376,
	"StackInuse": 1409024,
	"StackSys": 1409024,
	"Sys": 703486200,
	"TotalAlloc": 558957409032
}

i get that im configured to use 512mb but i thought that ended once a file was closed

rclone rc core/memstats
{
	"Alloc": 795612504,
	"BuckHashSys": 1830904,
	"Frees": 365592455,
	"GCSys": 78815232,
	"HeapAlloc": 795612504,
	"HeapIdle": 1468203008,
	"HeapInuse": 812089344,
	"HeapObjects": 3989089,
	"HeapReleased": 1208492032,
	"HeapSys": 2280292352,
	"MCacheInuse": 13888,
	"MCacheSys": 16384,
	"MSpanInuse": 6261840,
	"MSpanSys": 10731520,
	"Mallocs": 369581544,
	"OtherSys": 2809088,
	"StackInuse": 1409024,
	"StackSys": 1409024,
	"Sys": 2375904504,
	"TotalAlloc": 734637700584
}

The way memory is allocated on a system, those things are immediate as allocating memory is an expensive thing to do on a system.

You can see 2 things in your output there.

Is the important one as that's actual memory that's used so it's really consuming almost no memory at all.

The one that confuses folks is

That's a combo of physical and virtual memory, which in your case is primarily all in virtual.

So in my example, I have 0 files open:

felix@gemini:~$ rclone rc core/memstats
{
	"Alloc": 63614144,
	"BuckHashSys": 2383184,
	"Frees": 1052938382,
	"GCSys": 24014848,
	"HeapAlloc": 63614144,
	"HeapIdle": 562765824,
	"HeapInuse": 106913792,
	"HeapObjects": 628604,
	"HeapReleased": 562348032,
	"HeapSys": 669679616,
	"MCacheInuse": 13888,
	"MCacheSys": 16384,
	"MSpanInuse": 2315952,
	"MSpanSys": 4128768,
	"Mallocs": 1053566986,
	"OtherSys": 1854376,
	"StackInuse": 1409024,
	"StackSys": 1409024,
	"Sys": 703486200,
	"TotalAlloc": 559114459976
}
felix@gemini:~$ sudo lsof /GD

Here is the htop output that can correlate to that memstats that we were looking at.

So I'm using 129M of actual memory with 735M of virtual so in reality, hardly any physical memory is being consumed.

You'd need to repeat all those steps in close order to see memstats / open files and the final htop output.

i'm sorry if i'm being dumb here, but i reread that to put together the steps you mentioned from context and i can't seem to make out what the steps are

htop is a bit annoying by default as it shows threads by default.

So I hit F2 and turn off userland process threads:

image

I used the filter for rclone after that by hitting F4 and you should get my output.

By that output, I'd surmise, you probably have a few files open which are using the resident memory.

maybe it's emby scanning?


but reguardless it seems rclone is always using this amount of ram

i'll shut down emby later and show you the result

You can run:

sudo lsof "mountpoint of rclone"

and see what files are open.

COMMAND   PID USER   FD   TYPE DEVICE   SIZE/OFF                 NODE NAME
mergerfs 2751 root    4r   REG   0,57 3108199390 17449322331921355832 /mnt/media/tv/Carnival Row/Season 1/Carnival Row - S01E03 - Kingdoms of the Moon.mkv
mergerfs 2751 root    5r   REG   0,57   21284911 14667383646585032320 /mnt/media/music/69 Eyes/1995. Savage Garden/11 - Always.flac

i closed that episode like 30 minutes ago

So from the rclone side, it is telling you those are the two open files currently.

So something has that file open.

i was watching that episode like 30 minutes ago but closed it.
i'm pretty sure emby is scanning that song though

If you run against the actual mergerfs mount to backtrack, you can see has it open from the mergerfs side:

felix@gemini:~$ sudo lsof /gmedia | grep -v deluge
COMMAND     PID  USER   FD   TYPE DEVICE    SIZE/OFF                 NODE NAME
Plex\x20M  1380  plex  100r   REG   0,55  3580701634  5630626532448921240 /gmedia/TV/Carnival.Row/Carnival.Row.S01E01.mkv
nzbget     2152 felix    3uW  REG   0,55           5        9895604650130 /gmedia/NZB/nzbget.lock
Plex\x20T 30100  plex    6r   REG   0,55 11570128377 16712724863074808912 /gmedia/Movies/The Rocky Horror Picture Show (1975)/The Rocky Horror Picture Show (1975).mkv
Plex\x20T 30671  plex    6r   REG   0,55  9388564690  1906428910753120971 /gmedia/Movies/Soul Surfer (2011)/Soul Surfer (2011).mkv

So Plex has 3 things open now for me.

whoops nope im dumb, that episode was paused
i closed it now but same memory usage

COMMAND   PID USER   FD   TYPE DEVICE SIZE/OFF                NODE NAME
mergerfs 2751 root    4r   REG   0,57 23153971 2261362414055063846 /mnt/media/music/7 Year Bitch/1996. Gato Negro/05 - The Midst.flac

ffprobe 19013 emby    3r   REG   0,58 37680185 8794767550814175036 /mnt/unionfs/music/808 State/2008. 808 Archives Part I/2.02. Cobra Bora (Call The Cops Mix).flac

am i crazy or should it not be consuming that amount of memory with 1 file at a time open?
unless i missed something

It's a snapshot in time of when you run those commands.

From the output, you seem to be probing with Emby as it's running ffprobe against files so makes perfect sense.

Configure a smaller buffer size if you want to consume less memory per file.

forgive me if i'm being way too dumb here but a smaller buffer size would mean seeking while playing a video file would be slower right?

Unfortunately, that's not near a simple question as quite the number of factors can go into answering that.

buffer-size is memory used when something is sequentially reading a file and it is immediately dropped on a file close.

The clients / app really dictate how the file interaction works. Majority of them from what I've seen close and open the file to seek to the new position. It also depends if you are direct playing vs direct stream/full transcoding as the buffer size means nothing for the latter since the server is transcoding everything anyway.

I've tested so many different buffer sizes for Plex and Emby and primarily, I see no difference. My use case is almost all direct play as well.

yeah all of my personal use is direct play and my friends all transcode for some reason but i had no idea that transcoded plays were not effected which is pretty interesting

This topic was automatically closed 90 days after the last reply. New replies are no longer allowed.