Will check out the link you just posted and try to make a memory capture.
This is the results of doing lsof on the mountoint. BUT no one is accesing anything right now. I am the only one which is currently online in my network and I am not accessing those files.
[~] # lsof /share/CACHEDEV1_DATA/GDriveBackup
COMMAND    PID  USER   FD   TYPE DEVICE SIZE/OFF                 NODE NAME
vs_refres 3558 admin  cwd    DIR   0,31        0 13150540421081909035 /share/CACHEDEV1_DATA/GDriveBackup/Multimedia/Family/gelsas/DELL-XPS_8500/Data/C/Daten/ArchivedProjectfiles/ArchivedProjectfiles 2016/Prj/SENSITIVEINFORMATIONDELETED.prj
vs_refres 3558 admin    4r   DIR   0,31        0                    1 /share/CACHEDEV1_DATA/GDriveBackup
vs_refres 3558 admin    5r   DIR   0,31        0 11465421883166377183 /share/CACHEDEV1_DATA/GDriveBackup/Multimedia
vs_refres 3558 admin    6r   DIR   0,31        0 12158741749687591524 /share/CACHEDEV1_DATA/GDriveBackup/Multimedia/Family
vs_refres 3558 admin    7r   DIR   0,31        0 14800355792846338703 /share/CACHEDEV1_DATA/GDriveBackup/Multimedia/Family/gelsas
vs_refres 3558 admin    8r   DIR   0,31        0 15024279114291699993 /share/CACHEDEV1_DATA/GDriveBackup/Multimedia/Family/gelsas/DELL-XPS_8500
vs_refres 3558 admin    9r   DIR   0,31        0 18096138740963539151 /share/CACHEDEV1_DATA/GDriveBackup/Multimedia/Family/gelsas/DELL-XPS_8500/Data
vs_refres 3558 admin   10r   DIR   0,31        0 14583834261090589719 /share/CACHEDEV1_DATA/GDriveBackup/Multimedia/Family/gelsas/DELL-XPS_8500/Data/C
vs_refres 3558 admin   11r   DIR   0,31        0  3808151809423510442 /share/CACHEDEV1_DATA/GDriveBackup/Multimedia/Family/gelsas/DELL-XPS_8500/Data/C/Daten
vs_refres 3558 admin   12r   DIR   0,31        0 13602155881518389066 /share/CACHEDEV1_DATA/GDriveBackup/Multimedia/Family/gelsas/DELL-XPS_8500/Data/C/Daten/ArchivedProjectfiles
vs_refres 3558 admin   13r   DIR   0,31        0 12016387481096250024 /share/CACHEDEV1_DATA/GDriveBackup/Multimedia/Family/gelsas/DELL-XPS_8500/Data/C/Daten/ArchivedProjectfiles/ArchivedProjectfiles 2016
vs_refres 3558 admin   14r   DIR   0,31        0 15732103785771861237 /share/CACHEDEV1_DATA/GDriveBackup/Multimedia/Family/gelsas/DELL-XPS_8500/Data/C/Daten/ArchivedProjectfiles/ArchivedProjectfiles 2016/Prj
vs_refres 3558 admin   15r   DIR   0,31        0 13150540421081909035 /share/CACHEDEV1_DATA/GDriveBackup/Multimedia/Family/gelsas/DELL-XPS_8500/Data/C/Daten/ArchivedProjectfiles/ArchivedProjectfiles 2016/Prj/SENSITIVEINFORMATIONDELETED.prj
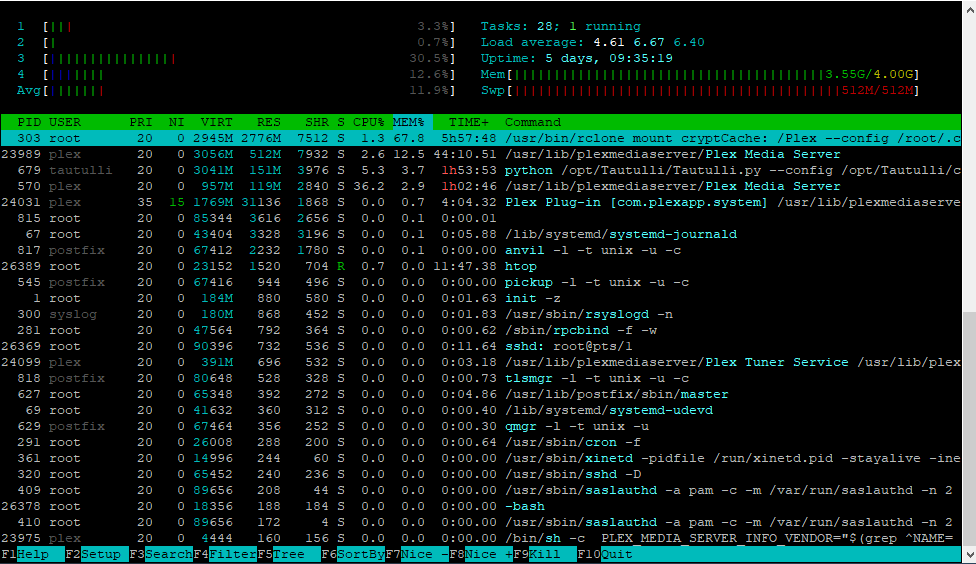
I too am looking for a way to identify what is going on. Every now and then, my memory usage will shoot up and lock up the server.
I know this isn’t the best method of showing the memory usage, but it was all I could capture before having to force boot the server.
Next time this happens, I would like to be ready to capture whatever is needed to identify what is going on. I will review the memory leak link above and the other data capture commands listed in this thread. But any other guidance would be appreciated.
When this happened, there were two movies being watched with Plex. One was a direct play, one transcode.
Normal memory usage while playing movies is under 2GB.
I’d start a fresh topic as the OP was related to QNAP scanning files and jumping his memory up.
@zSeriesGuy - few things. you can remove fast-list as it does nothing on a mount. If you are using cache, set your buffer-size to 0M the cache backend does it owns buffering thing. Your dir-cache-time is much higher than your info_age
You want your dir-cache-time to be lower than info_age.
allow-non-empty is really an awful parameter and not sure why it exists as it allows over mounting and really shouldn’t be used.
8M is super small and just makes a lot of API hits so something higher than 32M or 64M would be smoother. Plex integration makes everything slow until it figures out playback is going on and scans and such only use 1 worker.
You can run rclone cachestats on the remote and get some information that way.
@calisro There was nothing else going on with the mount. No uploads. Just two plex playback streams. I should have a log. But my server is stuck currently and the openvz node has to be rebooted. So it may be a few days before I can get to the log.
@Animosity022 Thank you for the suggestions. I made those suggested changes to my other two plex servers. I’ll make it to the stuck one once I can get to it. I used cache-chunk-size=32M. When I tested with 64M and two streams, memory usage went to a little over 3GB with rclone using over 40% memory. I only have 4GB and don’t want to push it too high. One thing I’m curious about though. Does the memory usage increase with each open stream? With only two streams and memory over 3GB, that could be bad.
I am also curious why rclone would use so much memory. Two streams with 4 cache workers with cache chunk size (buffer?) of 32M would only be 256M. This assumes each stream would each get 4 cache workers. But I guess this is a topic for another thread.
My main interest here is to understand what I can capture to help diagnose the problem. Memory dump perhaps?