Rclone rc High memory usage

[Animosity022]
Can you share the debug log and the memory dump?
https://rclone.org/rc/#debugging-memory-use

The only way that I can connect to the rclone is through https and I get this error:
https://ip:port/debug/pprof/goroutine?debug=1: x509: cannot validate certificate for <ip> because it doesn't contain any IP SANs
any help on this!

I used the core/memstats and here is the result:
"Alloc": 823668928, "BuckHashSys": 1687850, "Frees": 4699578171, "GCSys": 76943360, "HeapAlloc": 823668928, "HeapIdle": 1025417216, "HeapInuse": 985194496, "HeapObjects": 5096734, "HeapReleased": 565354496, "HeapSys": 2010611712, "MCacheInuse": 13888, "MCacheSys": 16384, "MSpanInuse": 18890672, "MSpanSys": 25673728, "Mallocs": 4704674905, "OtherSys": 7846094, "StackInuse": 2654208, "StackSys": 2654208, "Sys": 2125433336, "TotalAlloc": 1187534721016

An other machine which is receiving exactly same commands and has no memory issue:
"Alloc": 15428592, "BuckHashSys": 1823709, "Frees": 2667775013, "GCSys": 3791872, "HeapAlloc": 15428592, "HeapIdle": 76636160, "HeapInuse": 19111936, "HeapObjects": 98855, "HeapReleased": 66314240, "HeapSys": 95748096, "MCacheInuse": 13632, "MCacheSys": 16384, "MSpanInuse": 231696, "MSpanSys": 753664, "Mallocs": 2667873868, "OtherSys": 1447195, "StackInuse": 4915200, "StackSys": 4915200, "Sys": 108496120, "TotalAlloc": 720210779856

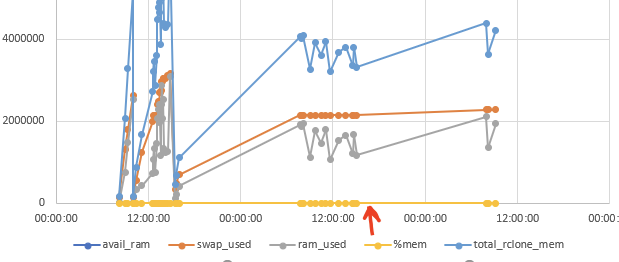
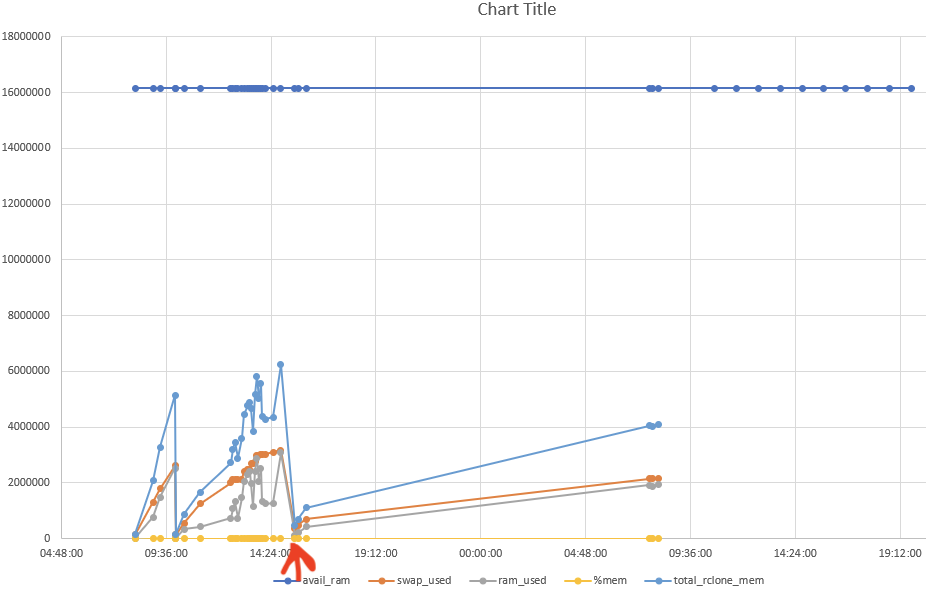
after reducing job expire duration the situation is much better. at least we have not ran out of memory yet. But memory consumption is still going up gradually.

The log file now is over 20Gb I am trying to download and open it

Here is the summary of the log file. What you see below is happening every 5min.

2020/02/05 07:33:15 DEBUG : rc: "options/set": with parameters map[filter:map[ExcludeRule:[] MaxAge:2.592e+14]]
2020/02/05 07:33:15 DEBUG : --max-age 3d to 2020-02-02 07:33:15.877082786 +0000 GMT m=-199648.576733031
2020/02/05 07:33:15 DEBUG : rc: "options/set": reply map[]: <nil>
2020/02/05 07:33:16 DEBUG : rc: "operations/list": with parameters map[fs:localdisk: opt:map[recurse:true] remote:<remote/dir>]
2020/02/05 07:33:16 DEBUG : <path/to/afile>: Excluded
........ lots of this to find those within in a given max age
2020/02/05 07:33:22 DEBUG : <path/to/afile>: Excluded
2020/02/05 07:33:22 DEBUG : rc: "operations/list": reply map[list:[0xc00c9969c0 0xc00c996a90 ......a list of 120000 files and folders]
2020/02/05 07:33:28 DEBUG : rc: "options/set": with parameters map[filter:map[MaxAge:9.4608e+17] main:map[MaxDepth:-1]]
2020/02/05 07:33:28 DEBUG : --max-age 30y to 1990-02-12 07:33:28.223183573 +0000 GMT m=-946020436.230632247
2020/02/05 07:33:28 DEBUG : rc: "options/set": reply map[]: <nil>
2020/02/05 07:33:28 DEBUG : rc: "sync/copy": with parameters map[dstFs:<destination> srcFs:<src/folder>]
2020/02/05 07:33:28 DEBUG : rc: "sync/copy": reply map[jobid:1259]: <nil>
2020/02/05 07:33:31 INFO  : Swift container <container name> path <path>: Waiting for checks to finish
2020/02/05 07:33:31 INFO  : Swift container <container name> path <path>: Waiting for transfers to finish
2020/02/05 07:33:32 INFO  : <file_name>: Copied (new)
...... 31 Copied (new)
2020/02/05 07:38:27 DEBUG : rc: "job/status": with parameters map[jobid:1259]
2020/02/05 07:38:27 DEBUG : rc: "job/status": reply map[duration:10.94590526 endTime:2020-02-05T07:33:39.583019409Z error: finished:true group:job/1259 id:1259 output:map[] startTime:2020-02-05T07:33:28.637114127Z success:true]: <nil>

This pattern Keeps repeating every 5 min. However, the sync/copy command happens about 60-100 times per day.

I could retrieve goroutine:

File: rclone
Type: goroutine
Time: Feb 5, 2020 at 3:46pm (GMT)
Showing nodes accounting for 7, 100% of 7 total
flat flat% sum% cum cum%
5 71.43% 71.43% 5 71.43% runtime.gopark
1 14.29% 85.71% 1 14.29% runtime.notetsleepg
1 14.29% 100% 1 14.29% runtime/pprof.writeRuntimeProfile
0 0% 100% 1 14.29% bytes.(*Buffer).ReadFrom
0 0% 100% 1 14.29% crypto/tls.(*Conn).Read
0 0% 100% 1 14.29% crypto/tls.(*Conn).readFromUntil
0 0% 100% 1 14.29% crypto/tls.(*Conn).readRecord
0 0% 100% 1 14.29% crypto/tls.(*Conn).readRecordOrCCS
0 0% 100% 1 14.29% crypto/tls.(*atLeastReader).Read
0 0% 100% 1 14.29% crypto/tls.(*listener).Accept
0 0% 100% 1 14.29% github.com/rclone/rclone/cmd.Main
0 0% 100% 1 14.29% github.com/rclone/rclone/cmd/rcd.glob..func1
0 0% 100% 1 14.29% github.com/rclone/rclone/cmd/serve/httplib.(*Server).Serve.func1
0 0% 100% 1 14.29% github.com/rclone/rclone/cmd/serve/httplib.(*Server).Wait
0 0% 100% 1 14.29% github.com/rclone/rclone/cmd/serve/httplib.NewServer.func1
0 0% 100% 1 14.29% github.com/rclone/rclone/vendor/github.com/spf13/cobra.(*Command).Execute
0 0% 100% 1 14.29% github.com/rclone/rclone/vendor/github.com/spf13/cobra.(*Command).ExecuteC
0 0% 100% 1 14.29% github.com/rclone/rclone/vendor/github.com/spf13/cobra.(*Command).execute
0 0% 100% 1 14.29% github.com/rclone/rclone/vendor/go.opencensus.io/stats/view.(*worker).start
0 0% 100% 1 14.29% internal/poll.(*FD).Accept
0 0% 100% 1 14.29% internal/poll.(*FD).Read
0 0% 100% 2 28.57% internal/poll.(*pollDesc).wait
0 0% 100% 2 28.57% internal/poll.(*pollDesc).waitRead
0 0% 100% 2 28.57% internal/poll.runtime_pollWait
0 0% 100% 1 14.29% io.ReadAtLeast
0 0% 100% 1 14.29% io.ReadFull
0 0% 100% 1 14.29% main.main
0 0% 100% 1 14.29% net.(*TCPListener).Accept
0 0% 100% 1 14.29% net.(*TCPListener).accept
0 0% 100% 1 14.29% net.(*conn).Read
0 0% 100% 1 14.29% net.(*netFD).Read
0 0% 100% 1 14.29% net.(*netFD).accept
0 0% 100% 1 14.29% net/http.(*ServeMux).ServeHTTP
0 0% 100% 1 14.29% net/http.(*Server).Serve
0 0% 100% 1 14.29% net/http.(*Server).ServeTLS
0 0% 100% 1 14.29% net/http.(*conn).serve
0 0% 100% 1 14.29% net/http.(*http2Framer).ReadFrame
0 0% 100% 1 14.29% net/http.(*http2Server).ServeConn
0 0% 100% 1 14.29% net/http.(*http2serverConn).readFrames
0 0% 100% 1 14.29% net/http.(*http2serverConn).runHandler
0 0% 100% 1 14.29% net/http.(*http2serverConn).serve
0 0% 100% 1 14.29% net/http.HandlerFunc.ServeHTTP
0 0% 100% 1 14.29% net/http.http2ConfigureServer.func1
0 0% 100% 1 14.29% net/http.http2readFrameHeader
0 0% 100% 1 14.29% net/http.initNPNRequest.ServeHTTP
0 0% 100% 1 14.29% net/http.serverHandler.ServeHTTP
0 0% 100% 1 14.29% net/http/pprof.Index
0 0% 100% 1 14.29% net/http/pprof.handler.ServeHTTP
0 0% 100% 1 14.29% os/signal.loop
0 0% 100% 1 14.29% os/signal.signal_recv
0 0% 100% 1 14.29% runtime.chanrecv
0 0% 100% 1 14.29% runtime.chanrecv1
0 0% 100% 1 14.29% runtime.goparkunlock
0 0% 100% 1 14.29% runtime.main
0 0% 100% 2 28.57% runtime.netpollblock
0 0% 100% 2 28.57% runtime.selectgo
0 0% 100% 1 14.29% runtime/pprof.(*Profile).WriteTo
0 0% 100% 1 14.29% runtime/pprof.writeGoroutine

and this the heap:

File: rclone
Type: inuse_space
Time: Feb 5, 2020 at 4:34pm (GMT)
Showing nodes accounting for 586.92MB, 97.19% of 603.87MB total
Dropped 83 nodes (cum <= 3.02MB)
flat flat% sum% cum cum%
406.58MB 67.33% 67.33% 423.01MB 70.05% github.com/rclone/rclone/fs/operations.ListJSON.func1
118.51MB 19.62% 86.95% 118.51MB 19.62% strings.(*Builder).grow
29.40MB 4.87% 91.82% 29.90MB 4.95% os.(*File).readdirnames
16.43MB 2.72% 94.54% 16.43MB 2.72% github.com/rclone/rclone/fs/operations.rcList.func1
6.50MB 1.08% 95.62% 6.50MB 1.08% github.com/rclone/rclone/backend/local.newFadvise
4.50MB 0.75% 96.36% 4.50MB 0.75% strings.genSplit
2MB 0.33% 96.70% 161.91MB 26.81% github.com/rclone/rclone/backend/local.(*Fs).List
1.50MB 0.25% 96.94% 6MB 0.99% github.com/rclone/rclone/lib/encoder.FromStandardPath
1.50MB 0.25% 97.19% 10MB 1.66% github.com/rclone/rclone/backend/local.(*Fs).newObject
0 0% 97.19% 115.51MB 19.13% github.com/rclone/rclone/backend/local.(*Fs).cleanRemote
0 0% 97.19% 8.50MB 1.41% github.com/rclone/rclone/backend/local.(*Fs).localPath
0 0% 97.19% 10MB 1.66% github.com/rclone/rclone/backend/local.(*Fs).newObjectWithInfo
0 0% 97.19% 8.50MB 1.41% github.com/rclone/rclone/backend/local.(*Object).Open
0 0% 97.19% 6.50MB 1.08% github.com/rclone/rclone/backend/local.newFadviseReadCloser
0 0% 97.19% 3.45MB 0.57% github.com/rclone/rclone/cmd/serve/httplib.NewServer.func1
0 0% 97.19% 3.45MB 0.57% github.com/rclone/rclone/fs.Debugf
0 0% 97.19% 3.45MB 0.57% github.com/rclone/rclone/fs.LogPrintf
0 0% 97.19% 3.45MB 0.57% github.com/rclone/rclone/fs.glob..func4
0 0% 97.19% 162.41MB 26.89% github.com/rclone/rclone/fs/list.DirSorted
0 0% 97.19% 8.50MB 1.41% github.com/rclone/rclone/fs/operations.(*reOpen).open
0 0% 97.19% 12.51MB 2.07% github.com/rclone/rclone/fs/operations.Copy
0 0% 97.19% 8.50MB 1.41% github.com/rclone/rclone/fs/operations.newReOpen
0 0% 97.19% 3.45MB 0.57% github.com/rclone/rclone/fs/rc/rcserver.(*Server).handlePost
0 0% 97.19% 3.45MB 0.57% github.com/rclone/rclone/fs/rc/rcserver.(*Server).handler
0 0% 97.19% 12.51MB 2.07% github.com/rclone/rclone/fs/sync.(*syncCopyMove).pairCopyOrMove
0 0% 97.19% 423.01MB 70.05% github.com/rclone/rclone/fs/walk.listRwalk.func1
0 0% 97.19% 584.91MB 96.86% github.com/rclone/rclone/fs/walk.walk.func2
0 0% 97.19% 6MB 0.99% github.com/rclone/rclone/lib/encoder.MultiEncoder.FromStandardPath
0 0% 97.19% 3.45MB 0.57% net/http.(*ServeMux).ServeHTTP
0 0% 97.19% 3.45MB 0.57% net/http.(*http2serverConn).runHandler
0 0% 97.19% 3.45MB 0.57% net/http.HandlerFunc.ServeHTTP
0 0% 97.19% 3.45MB 0.57% net/http.initNPNRequest.ServeHTTP
0 0% 97.19% 3.45MB 0.57% net/http.serverHandler.ServeHTTP
0 0% 97.19% 29.90MB 4.95% os.(*File).Readdirnames
0 0% 97.19% 115.51MB 19.13% path.Join
0 0% 97.19% 4MB 0.66% path/filepath.Join
0 0% 97.19% 4MB 0.66% path/filepath.join
0 0% 97.19% 118.51MB 19.62% strings.(*Builder).Grow
0 0% 97.19% 118.51MB 19.62% strings.Join
0 0% 97.19% 4.50MB 0.75% strings.Split

This looks like you are listing some big directories, or maybe copying or syncing them. 600 MB sounds quite a lot for directory listings though - do you have some directories with 100,000s of entries?

Yes, the directory is very large. We send list command with flag maxage=3d every 5 min. When it comes to copying we copy about 30 small files (few KB) every let say half an hour. (we have an algorithm in another server responsible to go through the list sent by rclone to identify what need to be copied to swift objectstore)
But should not rclone return the memory that is used for listing. If you look at memory usage graph you can see it is just going up linearly. Means no GC.

Memory usage used to go up to 25 GB (physical + swap memory) within 24h. After reducing job expire duration to 2h now physical + swap memory is about 4GB after 24h.

My question is why it just grows and never returns some memory?
Should we reduce buffer_size as well if it is going to be used for list operation?

Thanks

The memory usage in your dump was only 600 MB total which doesn't sound too huge.

Hmmm...

Can you do a heap dump when it is at 4GB please?

Also can you give a list of all the types of operation you are doing?

Buffer size is used for copies. It shouldn't be a problem but you can reduce it to 0 if you want and it won't affect performance much.

I did heap dump at the time that memory usage was about 4GB (physical + swap). Should I do it again?
Also I noticed during the night when we do not generate any new folder the rclone usage goes up linearly (please look at the straight line in the graph). What is your thought on this?
image

  1. Every 5 min we list all the files with max age=3d. Then we identify what need to be copied.
  2. Before copying the folder we wait 5 min then asking rclone to return the folder size (operations/size) for each qualified folder. Folder size is something between 2-20MB and we may need to send this command every 15-30 min, as the instrument does not generates new folder so often.
  3. If the folder size was constant we send sync/copy command in _async mode and saving the jobid
  4. Every 5 min if there is any copy jobid saved in our end, we will query the rclone to return the job status. We will delete the jobid from our end if status is finished.

The dump says there is only 600MB of memory in use. Go can be a bit wasteful in memory use but not normally that bad in that it is only using 600MB of 4GB allocated and still allocating more.

One thing you could try is setting the GOGC variable. Try export GOGC=20 which makes the garbage collector work harder.

Remember that if you are saving jobs then you are also saving the results from the jobs which might include those large listings.

1 Like

I am going to further reduce the job expire duration.
Also, I think sawp memory allocated to rclone is not part of pprof. am I right?
Thanks alot Nick

It should be part of the pprof.

This topic was automatically closed 90 days after the last reply. New replies are no longer allowed.